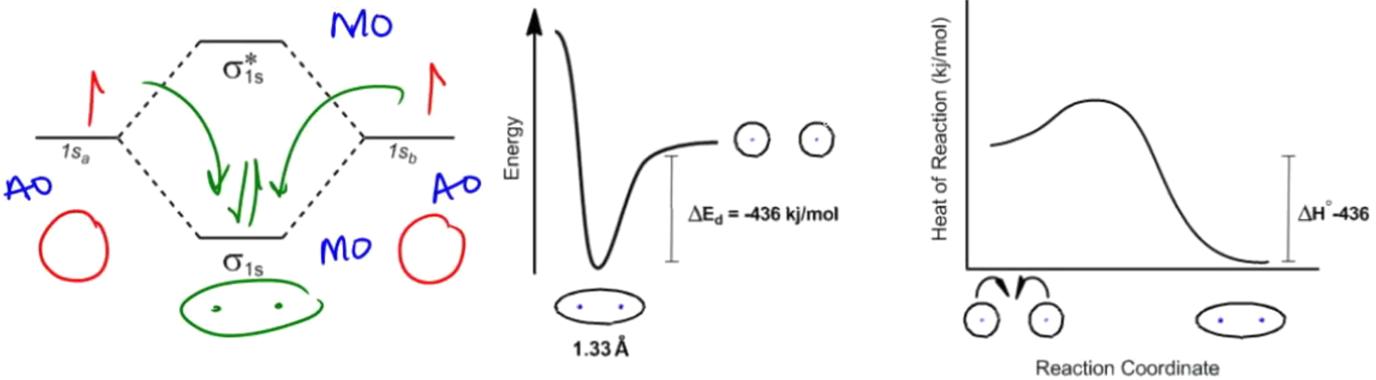
Understanding free energy diagrams is crucial in the study of thermodynamics and kinetics, as they encapsulate the energy changes and reaction pathways of chemical processes. These diagrams illustrate how energy is conserved when atoms form bonds, highlighting the transition from higher energy states to lower energy states as bonds are created. For instance, when two hydrogen atoms approach each other, they can share electrons, resulting in a decrease in energy, which is visually represented in the diagram.
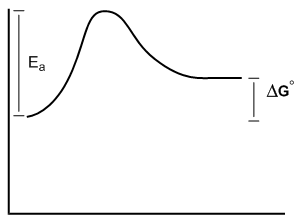
In a free energy diagram, the x-axis represents the reaction coordinate, indicating the progression of the reaction, while the y-axis typically reflects energy changes, such as enthalpy or Gibbs free energy (ΔG). The Gibbs free energy equation, ΔG = ΔH - TΔS, is fundamental in determining the spontaneity of a reaction. Here, ΔH represents the change in enthalpy, T is the temperature in Kelvin, and ΔS is the change in entropy. A negative ΔG indicates a spontaneous reaction, meaning it occurs favorably without external input.
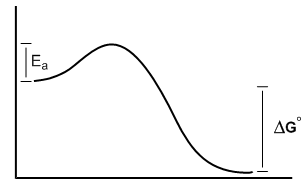
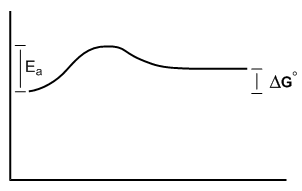
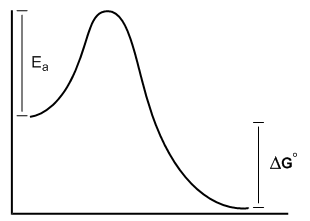
Additionally, the concept of activation energy is essential in kinetics, which refers to the energy barrier that must be overcome for a reaction to proceed. In the free energy diagram, activation energy is depicted as the energy difference between the reactants and the peak of the energy barrier. This energy requirement can influence the rate of the reaction, regardless of whether the reaction is thermodynamically favorable or not.
To assess the nature of various reactions, one can qualitatively analyze free energy diagrams to determine if they are spontaneous or non-spontaneous and whether they occur rapidly or slowly. This analysis provides insight into the interplay between thermodynamics and kinetics, allowing for a deeper understanding of chemical behavior and reaction dynamics.