
 05:02
05:02

Textbook Question
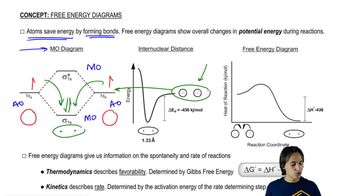
a. Which step in the reaction coordinate diagram shown here has the greatest free energy of activation in the forward direction?
b. Is the first-formed intermediate more apt to revert to reactants or go on to form products?
c. Which step is the rate-determining step of the reaction?
<IMAGE>