Textbook Question
Draw the reaction-energy diagram for the following reverse reaction:
•CH3 + HCl → CH4 + Cl•
 Verified step by step guidanceVerified video answer for a similar problem:
 02:49
02:49 07:45
07:45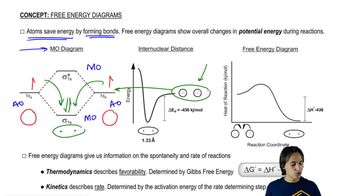 06:07
06:07 6:07m
6:07mMaster Introduction to free energy diagrams. with a bite sized video explanation from Johnny
Start learning