Join thousands of students who trust us to help them ace their exams!Watch the first video
Multiple Choice
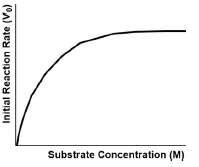
In the graph below, why does the curve have a steep incline at first that gradually declines to a horizontal line?
A
Because the substrate becomes an inhibitor at high concentrations.
B
Because the substrate is able to stimulate the enzyme at low concentration.
C
Because the transition state complex is more unstable at low substrate concentrations.
D
Because the available enzyme is saturated with substrate at high enough concentrations.
E
Because the Gibbs free energy approaches zero at high substrate concentrations.
0 Comments
Verified step by step guidance
1
Observe the graph, which plots the initial reaction rate (V₀) against substrate concentration. Notice the shape of the curve: it starts with a steep incline and then levels off to a horizontal line.
Understand that the initial steep incline indicates that as substrate concentration increases, the reaction rate also increases rapidly. This is because more substrate molecules are available to bind to the enzyme's active sites, increasing the rate of reaction.
Recognize that the curve begins to level off as it approaches a horizontal line. This suggests that the reaction rate is no longer increasing significantly with further increases in substrate concentration.
Interpret this leveling off as a sign of enzyme saturation. At high substrate concentrations, all the active sites of the enzyme molecules are occupied, and the enzyme is working at its maximum capacity, known as Vmax.
Conclude that the correct explanation for the curve's shape is that the available enzyme is saturated with substrate at high enough concentrations, which is why the reaction rate plateaus.


 Verified step by step guidance
