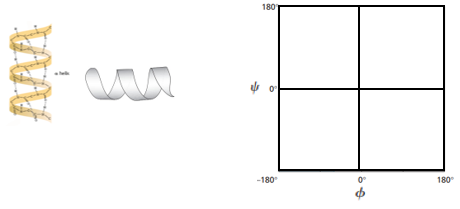
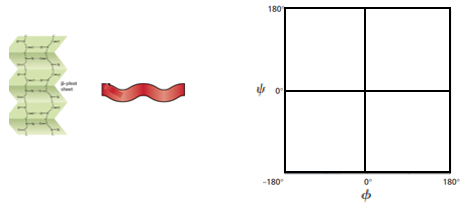
Ramachandran plots are essential tools in understanding the conformational angles of peptides, particularly focusing on the rotation around specific bonds in the peptide backbone. While the peptide bond itself exhibits restricted rotation due to its partial double bond character, the bonds around the alpha carbon allow for rotation, which is crucial for protein structure.
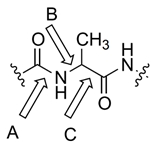
There are three primary bond rotation angles to be familiar with: phi (φ), psi (ψ), and omega (ω). The phi angle (φ) represents the rotation around the bond between the alpha carbon and the nitrogen atom in the backbone. In a peptide, this bond is critical for determining the overall shape and flexibility of the structure. The psi angle (ψ) refers to the rotation around the bond between the alpha carbon and the carbonyl carbon. This angle also plays a significant role in the conformation of the peptide. Lastly, the omega angle (ω) corresponds to the rotation around the peptide bond itself, which is largely restricted due to its partial double bond character, making it less relevant for Ramachandran plots.
To visualize these angles, consider a peptide with a glycine residue (where the R group is a hydrogen) and an alanine residue (where the R group is a methyl group). The phi bond is represented by the angle between the alpha carbon and the nitrogen, while the psi bond is the angle between the alpha carbon and the carbonyl carbon. The omega bond, although present, is typically not plotted due to its limited rotation.
Memory aids can help distinguish between these angles: the shape of the Greek letter phi (φ) resembles a larger version of a lowercase 'n', which can remind you of the nitrogen atom involved in the phi bond. Conversely, the letter psi (ψ) can be visualized as a sideways 'c' with a line through it, symbolizing the carbon atoms involved in the psi bond.
Each amino acid residue within a peptide has its own unique phi and psi angles, contributing to the overall conformation of the protein. Understanding these angles is crucial for interpreting Ramachandran plots, which graphically represent the allowed and disallowed regions of these angles, providing insights into the stability and structure of proteins.