Join thousands of students who trust us to help them ace their exams!Watch the first video
Multiple Choice
Which graph below corresponds with a reaction that has an equilibrium constant less than 1 (Keq < 1)?
A
B
C
0 Comments
Verified step by step guidance
1
Understand the concept of equilibrium constant (Keq). It is defined as the ratio of the concentration of products to the concentration of reactants at equilibrium. Mathematically, it is expressed as: .
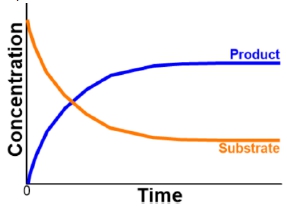
Analyze the graphs provided. Each graph shows the change in concentration of substrate and product over time until equilibrium is reached.
In the first graph, the concentration of the product is higher than the substrate at equilibrium, indicating a Keq greater than 1.
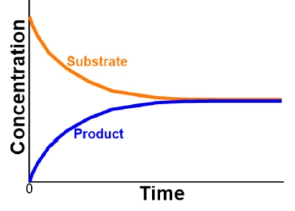
In the second graph, the concentrations of substrate and product are approximately equal at equilibrium, suggesting a Keq close to 1.
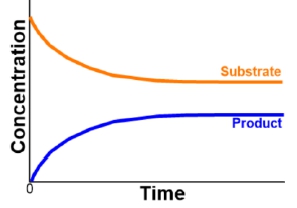
In the third graph, the concentration of the substrate is higher than the product at equilibrium, indicating a Keq less than 1. This is the graph that corresponds to a reaction with an equilibrium constant less than 1.


 Verified step by step guidance
