Join thousands of students who trust us to help them ace their exams!Watch the first video
Multiple Choice
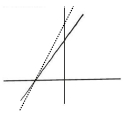
What can be determined from the following Lineweaver Burk plot?
A
Data collected in the absence (solid line) & presence (dashed line) of a competitive inhibitor.
B
Data collected in the absence (solid line) & presence (dashed line) of a noncompetitive inhibitor.
C
Data collected in the absence (dashed line) & presence (solid line) of a competitive inhibitor.
D
Data collected in the absence (dashed line) & presence (solid line) of a noncompetitive inhibitor.
Verified step by step guidance
1
Understand that a Lineweaver-Burk plot is a double reciprocal plot of enzyme kinetics, where 1/[V] (reaction velocity) is plotted against 1/[S] (substrate concentration).
Identify the lines on the plot: the solid line represents data collected in the absence of an inhibitor, and the dashed line represents data collected in the presence of an inhibitor.
Recognize that in a Lineweaver-Burk plot, a competitive inhibitor increases the slope of the line (Km/Vmax) without affecting the y-intercept (1/Vmax), while a noncompetitive inhibitor increases the y-intercept (1/Vmax) without affecting the x-intercept (-1/Km).
Observe the plot: the dashed line (inhibitor present) intersects the y-axis at the same point as the solid line (no inhibitor), indicating that Vmax is unchanged, which is characteristic of competitive inhibition.
Conclude that the data collected in the absence of the inhibitor is represented by the solid line, and the data collected in the presence of a competitive inhibitor is represented by the dashed line.