Join thousands of students who trust us to help them ace their exams!Watch the first video
Multiple Choice
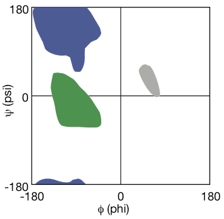
If the phi & psi angles of loop regions are plotted, where do they tend to fall on the Ramachandran plot below?
A
The area labeled in green.
B
The area labeled in blue.
C
The area labeled in grey.
D
All the above.
0 Comments
Verified step by step guidance
1
Understand the Ramachandran plot: It is a graphical representation of the phi (φ) and psi (ψ) dihedral angles of amino acid residues in protein structure. The plot shows the allowed regions for these angles, which correspond to different types of secondary structures.
Identify the regions on the plot: The plot is divided into different colored areas. The green area typically represents the allowed region for beta sheets, the blue area for alpha helices, and the grey area for left-handed helices or other less common conformations.
Recognize the nature of loop regions: Loop regions in proteins are flexible and do not have a regular secondary structure like alpha helices or beta sheets. Therefore, their phi and psi angles can vary widely.
Determine where loop regions fall on the plot: Since loop regions are flexible, their phi and psi angles can fall into any of the allowed regions on the Ramachandran plot, including the green, blue, and grey areas.
Conclude that loop regions can be found in all the labeled areas: Given their flexibility, loop regions can have phi and psi angles that fall into all the labeled areas on the plot, which is why the correct answer is 'All the above.'


 Verified step by step guidance
