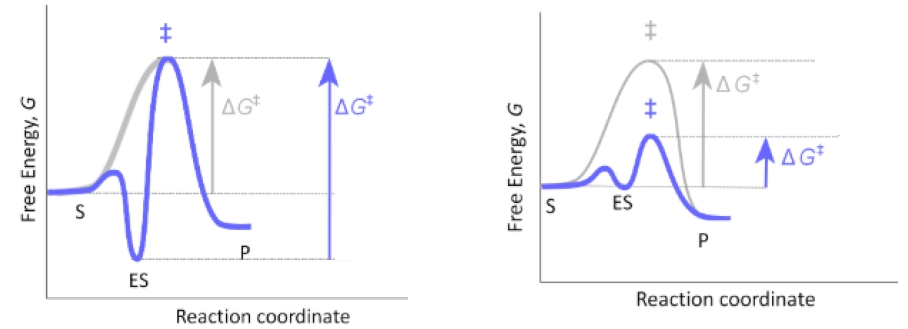
Join thousands of students who trust us to help them ace their exams!Watch the first video
Multiple Choice
Select the best option that fills in the blanks appropriately in the order of their appearance. The left graph depicts an energy diagram for the '_____________' model of enzyme-substrate specificity, whereas the right diagram depicts an energy diagram for the modern '_____________' model. In the lock & key model, the enzyme binds tightly and precisely to the '_____________.' In the induced fit model, the enzyme binds weakly to the '_____________' and then changes conformation to bind tightly to the '_____________.'
A
Lock & Key ; Induced fit ; transition state ; substrate ; product.
B
Lock & Key ; Induced fit ; substrate, transition state ; product.
Identify the two models of enzyme-substrate specificity: the 'Lock & Key' model and the 'Induced Fit' model.
Examine the left graph: it shows a single peak in the energy diagram, which is characteristic of the 'Lock & Key' model where the enzyme binds tightly and precisely to the substrate.
Examine the right graph: it shows a more complex energy diagram with an initial binding followed by a conformational change, characteristic of the 'Induced Fit' model where the enzyme initially binds weakly to the substrate and then changes conformation to bind tightly to the transition state.
Understand that in the 'Lock & Key' model, the enzyme-substrate complex (ES) is formed with a precise fit, while in the 'Induced Fit' model, the enzyme undergoes a conformational change to better fit the substrate and stabilize the transition state.
Select the correct answer based on the analysis: 'Lock & Key ; Induced fit ; substrate; substrate; transition state.'