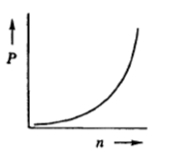
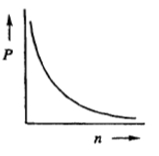
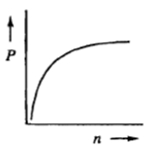
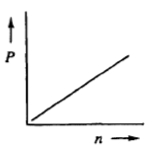
Join thousands of students who trust us to help them ace their exams!Watch the first video
Multiple Choice
The relationship between the partial pressure of a gas (P) and the number of moles of that gas (n) is best represented by which of the following graphs?
A
B
C
D
Verified step by step guidance
1
Recall the ideal gas law equation: \( PV = nRT \), where \( P \) is the pressure, \( V \) is the volume, \( n \) is the number of moles, \( R \) is the ideal gas constant, and \( T \) is the temperature.
Rearrange the ideal gas law to express pressure \( P \) in terms of the number of moles \( n \): \( P = \frac{nRT}{V} \).
Assume that the volume \( V \) and temperature \( T \) are constant. This implies that \( P \) is directly proportional to \( n \), i.e., \( P \propto n \).
Identify the type of graph that represents a direct proportionality between two variables. This is a straight line passing through the origin.
Examine the provided graphs and select the one that shows a linear relationship between \( P \) and \( n \), which is graph (d).