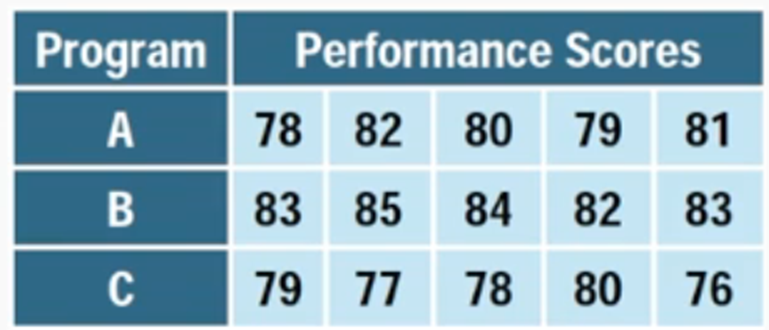
A school administrator wants to examine whether students' academic performance differs based on the type of instructional method used in their classes. A random sample of students is selected and divided evenly among the three teaching methods. After a semester, all students take the same standardized final exam. State the null and alternative hypotheses for a one-way ANOVA test.
Table of contents
- 1. Introduction to Statistics53m
- 2. Describing Data with Tables and Graphs2h 1m
- 3. Describing Data Numerically1h 48m
- 4. Probability2h 26m
- 5. Binomial Distribution & Discrete Random Variables2h 55m
- 6. Normal Distribution & Continuous Random Variables1h 48m
- 7. Sampling Distributions & Confidence Intervals: Mean2h 8m
- 8. Sampling Distributions & Confidence Intervals: Proportion1h 20m
- 9. Hypothesis Testing for One Sample2h 23m
- 10. Hypothesis Testing for Two Samples3h 25m
- 11. Correlation1h 6m
- 12. Regression1h 4m
- 13. Chi-Square Tests & Goodness of Fit1h 30m
- 14. ANOVA1h 4m
14. ANOVA
Introduction to ANOVA
Struggling with Statistics for Business?
Join thousands of students who trust us to help them ace their exams!Watch the first videoMultiple Choice
A regional sales director wants to determine whether different customer service training programs lead to different levels of employee performance across three branches. Each branch uses one of the following training programs: Program A. Program B, or Program C. After one month, the director measures the performance score (out of 100) for 5 randomly selected employees from each branch. Using α=0.05, perform a one-way ANOVA to determine whether there is a statistically significant difference in mean performance among the three training programs.

A
Since the performance scores for all three programs (A, B, and C) range from 76 to 85, there is no statistically significant difference between the training programs.
B
The P-value from the one-way ANOVA is greater than 0.05, so we fail to reject the null hypothesis and conclude that the type of training program does not affect employee performance.
C
The P-value from the one-way ANOVA is less than 0.05, so we reject the and suggest .
D
The one-way ANOVA is inappropriate for this study because it compares two groups only, a different statistical test should be used.

1
Step 1: Define the null hypothesis (H₀) and the alternative hypothesis (Hₐ). H₀: The mean performance scores are the same across all three training programs (Program A, Program B, and Program C). Hₐ: At least one training program has a different mean performance score.
Step 2: Calculate the group means for each training program. For Program A, calculate the mean of the scores {78, 82, 80, 79, 81}. For Program B, calculate the mean of the scores {83, 85, 84, 82, 83}. For Program C, calculate the mean of the scores {79, 77, 78, 80, 76}.
Step 3: Compute the overall mean (grand mean) by averaging all the performance scores across the three programs. Add all the scores together and divide by the total number of scores (15).
Step 4: Calculate the between-group sum of squares (SSB) and the within-group sum of squares (SSW). SSB measures the variation between the group means and the grand mean, while SSW measures the variation within each group. Use the formulas: SSB = Σnᵢ(μᵢ - μ)² and SSW = ΣΣ(xᵢⱼ - μᵢ)², where nᵢ is the number of observations in group i, μᵢ is the mean of group i, μ is the grand mean, and xᵢⱼ is an individual observation.
Step 5: Perform the one-way ANOVA test by calculating the F-statistic using the formula F = (SSB / df_between) / (SSW / df_within), where df_between = k - 1 (number of groups minus 1) and df_within = N - k (total number of observations minus number of groups). Compare the calculated F-statistic to the critical F-value at α = 0.05 or use the P-value to determine whether to reject or fail to reject the null hypothesis.
Watch next
Master Introduction to ANOVA with a bite sized video explanation from Patrick
Start learningRelated Videos
Related Practice
Multiple Choice