Table of contents
- 1. Introduction to Statistics53m
- 2. Describing Data with Tables and Graphs2h 2m
- 3. Describing Data Numerically2h 8m
- 4. Probability2h 26m
- 5. Binomial Distribution & Discrete Random Variables3h 28m
- 6. Normal Distribution & Continuous Random Variables2h 21m
- 7. Sampling Distributions & Confidence Intervals: Mean3h 37m
- Sampling Distribution of the Sample Mean and Central Limit Theorem19m
- Distribution of Sample Mean - Excel23m
- Introduction to Confidence Intervals22m
- Confidence Intervals for Population Mean1h 26m
- Determining the Minimum Sample Size Required12m
- Finding Probabilities and T Critical Values - Excel28m
- Confidence Intervals for Population Means - Excel25m
- 8. Sampling Distributions & Confidence Intervals: Proportion2h 20m
- 9. Hypothesis Testing for One Sample5h 15m
- Steps in Hypothesis Testing1h 13m
- Performing Hypothesis Tests: Means1h 1m
- Hypothesis Testing: Means - Excel42m
- Performing Hypothesis Tests: Proportions39m
- Hypothesis Testing: Proportions - Excel27m
- Performing Hypothesis Tests: Variance12m
- Critical Values and Rejection Regions29m
- Link Between Confidence Intervals and Hypothesis Testing12m
- Type I & Type II Errors16m
- 10. Hypothesis Testing for Two Samples5h 35m
- Two Proportions1h 12m
- Two Proportions Hypothesis Test - Excel28m
- Two Means - Unknown, Unequal Variance1h 2m
- Two Means - Unknown Variances Hypothesis Test - Excel12m
- Two Means - Unknown, Equal Variance15m
- Two Means - Unknown, Equal Variances Hypothesis Test - Excel9m
- Two Means - Known Variance12m
- Two Means - Sigma Known Hypothesis Test - Excel21m
- Two Means - Matched Pairs (Dependent Samples)42m
- Matched Pairs Hypothesis Test - Excel12m
- Two Variances and F Distribution29m
- Two Variances - Graphing Calculator15m
- 11. Correlation1h 24m
- 12. Regression3h 42m
- Linear Regression & Least Squares Method26m
- Residuals12m
- Coefficient of Determination12m
- Regression Line Equation and Coefficient of Determination - Excel8m
- Finding Residuals and Creating Residual Plots - Excel11m
- Inferences for Slope32m
- Enabling Data Analysis Toolpak1m
- Regression Readout of the Data Analysis Toolpak - Excel21m
- Prediction Intervals13m
- Prediction Intervals - Excel19m
- Multiple Regression - Excel29m
- Quadratic Regression23m
- Quadratic Regression - Excel10m
- 13. Chi-Square Tests & Goodness of Fit2h 31m
- 14. ANOVA2h 32m
3. Describing Data Numerically
Mode
3. Describing Data Numerically
Mode: Videos & Practice Problems
1
concept
Mode
Video duration:
3mPlay a video:
Study Smarter with Worksheets.
Follow along with each video using our printable worksheets

2
Problem
Find the mode of the data in the stemplot below.
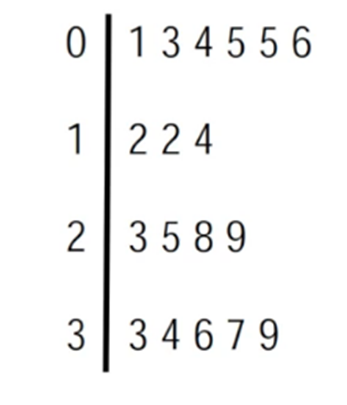
A
5,2
B
5,12
C
12
D
0 Comments for
3
Problem
Find the mode of the data in the table below. Is the data unimodal, bimodal, or multimodal?
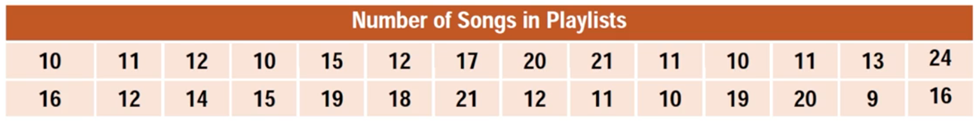
A
11,12; Bimodal
B
10; unimodal
C
11; unimodal
D
10,11,12; Multimodal
0 Comments for
Do you want more practice?
We have more practice problems on Mode

