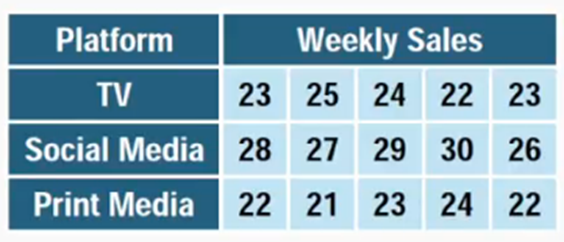
A company wants to determine whether the average monthly sales differ among three different regions: North, South, and West. The company collects monthly sales data (in thousands of dollars) from four randomly selected stores in each region over the same month. Calculate the F-statistic given the Mean Square due to Treatments: MST = (variance between groups) and the Mean Square due to Error: MSE = (variance within groups).
Table of contents
- 1. Introduction to Statistics53m
- 2. Describing Data with Tables and Graphs2h 1m
- 3. Describing Data Numerically1h 48m
- 4. Probability2h 26m
- 5. Binomial Distribution & Discrete Random Variables2h 55m
- 6. Normal Distribution & Continuous Random Variables1h 48m
- 7. Sampling Distributions & Confidence Intervals: Mean2h 8m
- 8. Sampling Distributions & Confidence Intervals: Proportion1h 20m
- 9. Hypothesis Testing for One Sample2h 23m
- 10. Hypothesis Testing for Two Samples3h 25m
- 11. Correlation1h 6m
- 12. Regression1h 4m
- 13. Chi-Square Tests & Goodness of Fit1h 30m
- 14. ANOVA1h 4m
14. ANOVA
Introduction to ANOVA
Struggling with Statistics for Business?
Join thousands of students who trust us to help them ace their exams!Watch the first videoMultiple Choice
A marketing manager wants to evaluate whether three different advertising platforms-TV, social media, and print media-lead to different average sales performance across regional stores. She runs a 4-week advertising campaign, assigning one platform to a group of 5 stores each (15 stores total). After the campaign, she collects the average weekly sales (in $1,000s) for each store during the campaign period. She wants to determine whether there is a statistically significant difference in mean sales among the three advertising platforms. State the null & alternative hypotheses for a one-way ANOVA test.

A
: All means are the same
: At least one advertising platform leads to a significant difference in average sales.
B
H0: At least one advertising platform leads to a significant difference in average sales.
Ha: All means are the same.
C
H0: There is a significant difference in the mean sales among the three advertising platforms.
Ha: There is no significant difference in the mean sales among the three advertising platforms.
D
H0: The mean sales are equal for TV advertising but differ for social media and print media platforms.
Ha: The mean sales differ for all three advertising platforms.

1
Step 1: Define the null hypothesis (H₀) and the alternative hypothesis (Hₐ) for the one-way ANOVA test. H₀: All means are the same (no significant difference in average sales among the three advertising platforms). Hₐ: At least one advertising platform leads to a significant difference in average sales.
Step 2: Organize the data into groups based on the advertising platform. From the table, the weekly sales for TV are {23, 25, 24, 22, 23}, for Social Media are {28, 27, 29, 30, 26}, and for Print Media are {22, 21, 23, 24, 22}.
Step 3: Calculate the group means and the overall mean. The group means are the average weekly sales for each platform, and the overall mean is the average of all sales data combined.
Step 4: Compute the sum of squares between groups (SSB) and the sum of squares within groups (SSW). SSB measures the variation between the group means and the overall mean, while SSW measures the variation within each group.
Step 5: Use the ANOVA formula to calculate the F-statistic: F = (SSB / df_between) / (SSW / df_within), where df_between = number of groups - 1 and df_within = total number of observations - number of groups. Compare the F-statistic to the critical value from the F-distribution table at the chosen significance level (e.g., α = 0.05) to determine whether to reject H₀.
Watch next
Master Introduction to ANOVA with a bite sized video explanation from Patrick
Start learningRelated Videos
Related Practice
Multiple Choice