In statistical analysis, understanding how to find probabilities associated with z-scores is crucial, especially when dealing with normal distributions. A z-score represents the number of standard deviations a data point is from the mean. To find probabilities from z-scores, one can utilize a z-table or a graphing calculator, such as the TI-84, which simplifies the process significantly.
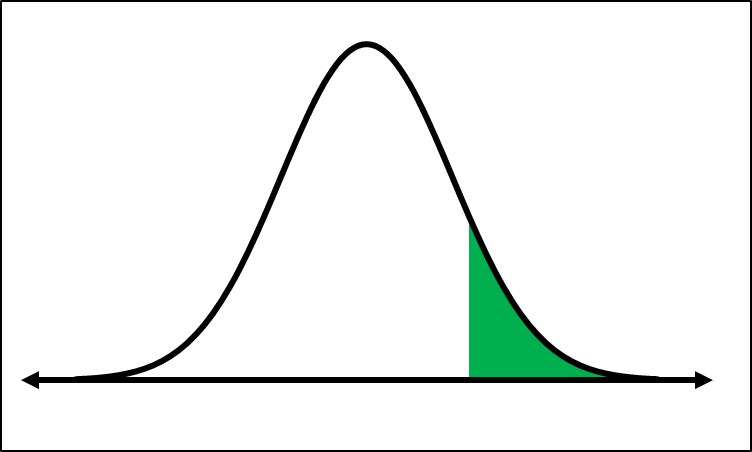
When using a calculator, the first step is to visualize the problem by sketching a graph. For instance, if you want to find the probability that a z-score is less than -0.81, you would draw a normal distribution curve, marking the z-score on the x-axis. The area to the left of this z-score represents the probability.
To calculate this using the TI-84, access the distribution menu by pressing 2nd followed by VARS. From there, select the normalcdf function for numerical output or shade normal for a graphical representation. For a probability that z is less than a specific value, set the lower bound to a very large negative number (e.g., -1E99) and the upper bound to the z-score in question, which in this case is -0.81. The mean (μ) is 0 and the standard deviation (σ) is 1 for a standard normal distribution, so these values remain unchanged. After entering these parameters, hitting the DRAW button will display the graph and the corresponding area, which represents the probability.
For example, the area calculated for z < -0.81 is approximately 0.209, matching the value obtained from the z-table.
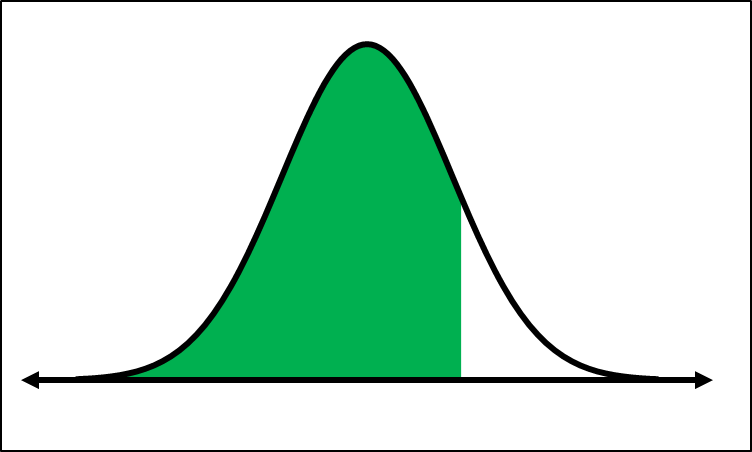
In scenarios where you need to find the probability between two z-scores, such as between -1 and 1, the process is similar. Again, sketch the normal distribution curve, marking both z-scores. This time, when using the calculator, set the lower bound to -1 and the upper bound to 1. The calculator will then compute the area between these two z-scores, which represents the probability of a z-score falling within that range. For this example, the area calculated is approximately 0.6827, confirming the results from previous calculations.
Utilizing a graphing calculator not only streamlines the process of finding probabilities associated with z-scores but also reduces the likelihood of errors that can occur when using a z-table. This method is particularly beneficial for more complex problems involving multiple z-scores or when visual representation aids in understanding the distribution of data.