3. Describing Data Numerically
Percentiles & Quartiles
3. Describing Data Numerically
Percentiles & Quartiles: Videos & Practice Problems
1
concept
Percentiles and Quartiles
Video duration:
7m Study Smarter with Worksheets.
Follow along with each video using our printable worksheets

2
Problem
Answer the questions below using the data in the table.
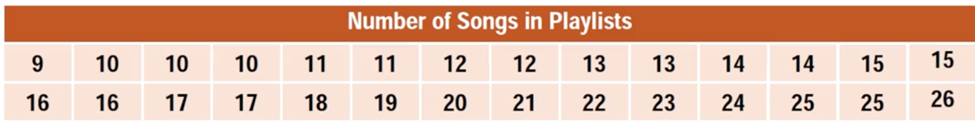
(A) Find
(B) A playlist with 15 songs is in which percentile?
(C) Find Q1 and Q3
A
(A) ; (B) percentile; (C) &
B
(A) ; (B) percentile; (C) &
C
(A) ; (B) percentile; (C) &
D
(A) ; (B) percentile; (C) &
3
example
Percentiles and Quartiles Example 1
Video duration:
2mDo you want more practice?
We have more practice problems on Percentiles & Quartiles

