A regional sales director wants to determine whether different customer service training programs lead to different levels of employee performance across three branches. Each branch uses one of the following training programs: Program A. Program B, or Program C. After one month, the director measures the performance score (out of 100) for 5 randomly selected employees from each branch. Using , perform a one-way ANOVA to determine whether there is a statistically significant difference in mean performance among the three training programs.
Table of contents
- 1. Introduction to Statistics53m
- 2. Describing Data with Tables and Graphs2h 2m
- 3. Describing Data Numerically2h 8m
- 4. Probability2h 26m
- 5. Binomial Distribution & Discrete Random Variables3h 28m
- 6. Normal Distribution & Continuous Random Variables2h 21m
- 7. Sampling Distributions & Confidence Intervals: Mean3h 37m
- Sampling Distribution of the Sample Mean and Central Limit Theorem19m
- Distribution of Sample Mean - Excel23m
- Introduction to Confidence Intervals22m
- Confidence Intervals for Population Mean1h 26m
- Determining the Minimum Sample Size Required12m
- Finding Probabilities and T Critical Values - Excel28m
- Confidence Intervals for Population Means - Excel25m
- 8. Sampling Distributions & Confidence Intervals: Proportion2h 20m
- 9. Hypothesis Testing for One Sample5h 15m
- Steps in Hypothesis Testing1h 13m
- Performing Hypothesis Tests: Means1h 1m
- Hypothesis Testing: Means - Excel42m
- Performing Hypothesis Tests: Proportions39m
- Hypothesis Testing: Proportions - Excel27m
- Performing Hypothesis Tests: Variance12m
- Critical Values and Rejection Regions29m
- Link Between Confidence Intervals and Hypothesis Testing12m
- Type I & Type II Errors16m
- 10. Hypothesis Testing for Two Samples5h 35m
- Two Proportions1h 12m
- Two Proportions Hypothesis Test - Excel28m
- Two Means - Unknown, Unequal Variance1h 2m
- Two Means - Unknown Variances Hypothesis Test - Excel12m
- Two Means - Unknown, Equal Variance15m
- Two Means - Unknown, Equal Variances Hypothesis Test - Excel9m
- Two Means - Known Variance12m
- Two Means - Sigma Known Hypothesis Test - Excel21m
- Two Means - Matched Pairs (Dependent Samples)42m
- Matched Pairs Hypothesis Test - Excel12m
- Two Variances and F Distribution29m
- Two Variances - Graphing Calculator15m
- 11. Correlation1h 24m
- 12. Regression3h 42m
- Linear Regression & Least Squares Method26m
- Residuals12m
- Coefficient of Determination12m
- Regression Line Equation and Coefficient of Determination - Excel8m
- Finding Residuals and Creating Residual Plots - Excel11m
- Inferences for Slope32m
- Enabling Data Analysis Toolpak1m
- Regression Readout of the Data Analysis Toolpak - Excel21m
- Prediction Intervals13m
- Prediction Intervals - Excel19m
- Multiple Regression - Excel29m
- Quadratic Regression23m
- Quadratic Regression - Excel10m
- 13. Chi-Square Tests & Goodness of Fit2h 31m
- 14. ANOVA2h 32m
14. ANOVA
Introduction to ANOVA
Struggling with Statistics for Business?
Join thousands of students who trust us to help them ace their exams!Watch the first videoMultiple Choice
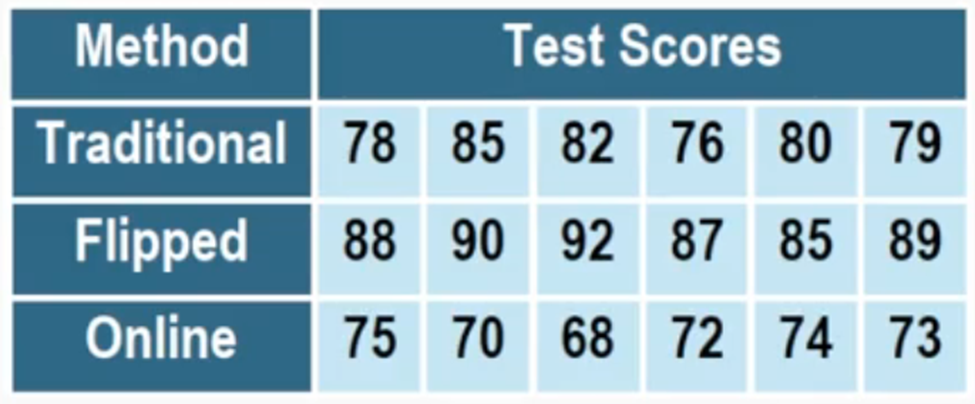
A school administrator wants to examine whether students' academic performance differs based on the type of instructional method used in their classes. A random sample of 18 students is selected and divided evenly among the three teaching methods. After a semester, all students take the same standardized final exam. An ANOVA test is performed and results in a P-value of 1.403∙10−7. Interpret these results.

A
The P-value is very high, so there is insufficient evidence to suggest that the type of instructional method has an effect on academic performance.
B
At least one method has a different average test score. Reject the null hypothesis.
C
There is no difference in academic performance, but further testing is required to make a definitive conclusion.
D
The P-value is close to 1, suggesting that the type of instructional method has no impact on students' academic performance.
0 Comments
 Verified step by step guidance
1
Step 1: Understand the problem. The school administrator wants to determine if the type of instructional method (Traditional, Flipped, Online) affects students' academic performance. An ANOVA test is used to compare the means of test scores across the three groups.
Step 2: Recall the null and alternative hypotheses for an ANOVA test. The null hypothesis (H₀) states that all group means are equal, i.e., the type of instructional method has no effect on academic performance. The alternative hypothesis (H₁) states that at least one group mean is different.
Step 3: Examine the P-value provided in the problem. The P-value is 1.403 × 10⁻⁷, which is extremely small. In hypothesis testing, if the P-value is less than the significance level (commonly α = 0.05), we reject the null hypothesis.
Step 4: Interpret the results. Since the P-value is much smaller than 0.05, we reject the null hypothesis. This indicates that there is sufficient evidence to conclude that at least one instructional method has a different average test score compared to the others.
Step 5: Relate the conclusion to the data. The test scores provided in the table show noticeable differences in averages between the methods (e.g., Flipped scores are generally higher than Traditional and Online). This supports the statistical conclusion that the type of instructional method impacts academic performance.

 6:46m
6:46mWatch next
Master Introduction to ANOVA with a bite sized video explanation from Patrick
Start learningRelated Videos
Related Practice
Multiple Choice
Introduction to ANOVA practice set


