


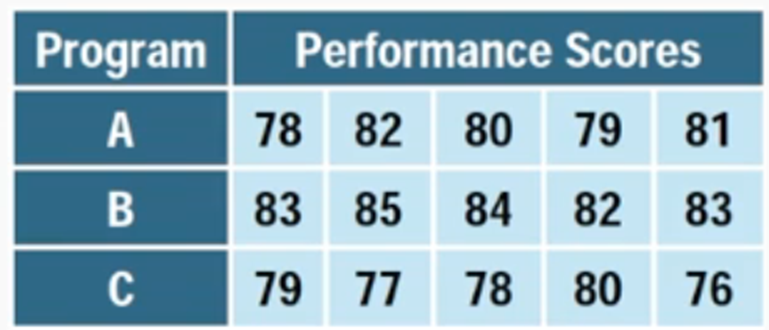
In this scenario, a nutritionist is investigating the effectiveness of three different diet plans (A, B, and C) by conducting an experiment over six weeks with 15 participants, assigning five individuals to each diet plan. The primary goal is to determine if there is a significant difference in mean weight loss among the three diets. To analyze the data, an Analysis of Variance (ANOVA) test is employed, which is suitable for comparing the means of multiple groups.
The first step in the analysis involves formulating the null and alternative hypotheses. The null hypothesis states that the mean weight loss for all three diet plans is equal, expressed mathematically as:
\[ H_0: \mu_A = \mu_B = \mu_C \]
Conversely, the alternative hypothesis posits that at least one diet plan has a different mean weight loss, represented as:
\[ H_a: \text{At least one } \mu \text{ is different} \]
To perform the ANOVA test using a TI-84 calculator, the data for each diet plan is entered into separate lists. After entering the data, the user navigates to the statistical tests menu, selects the ANOVA test option, and inputs the corresponding lists for the three diet plans.
Upon running the test, the calculator provides an F-statistic of 25.298 and a p-value of approximately \(4.96 \times 10^{-4}\). This p-value is significantly lower than the common alpha level of 0.05, leading to the rejection of the null hypothesis. Therefore, it can be concluded that at least one of the diet plans results in a significantly different amount of weight loss.
This analysis highlights the importance of using ANOVA for comparing means across multiple groups and demonstrates how statistical tools can aid in making informed decisions based on experimental data.

