Determine if each curve (in orange) is a valid probability density function (i.e. if the total area under the function = 1)
Table of contents
- 1. Introduction to Statistics53m
- 2. Describing Data with Tables and Graphs2h 1m
- 3. Describing Data Numerically1h 48m
- 4. Probability2h 26m
- 5. Binomial Distribution & Discrete Random Variables2h 55m
- 6. Normal Distribution & Continuous Random Variables1h 48m
- 7. Sampling Distributions & Confidence Intervals: Mean2h 8m
- 8. Sampling Distributions & Confidence Intervals: Proportion1h 20m
- 9. Hypothesis Testing for One Sample2h 23m
- 10. Hypothesis Testing for Two Samples3h 25m
- 11. Correlation1h 6m
- 12. Regression1h 4m
- 13. Chi-Square Tests & Goodness of Fit1h 30m
- 14. ANOVA1h 4m
6. Normal Distribution & Continuous Random Variables
Uniform Distribution
Struggling with Statistics for Business?
Join thousands of students who trust us to help them ace their exams!Watch the first videoMultiple Choice
Determine if each curve (in orange) is a valid probability density function (i.e. if the total area under the function = 1)

A
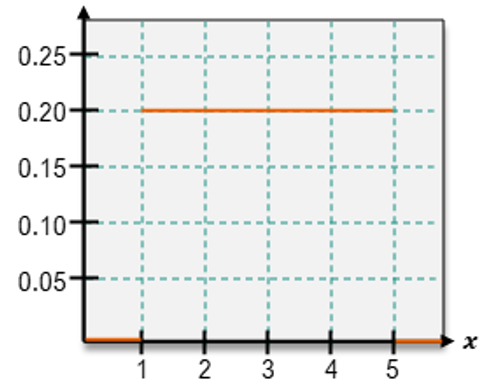
Yes, because the area under the curve equals 1
B
No, because the area under the curve = 8=1
C
No, because the curve does not touch the x-axis
D
Yes, because the area under the curve is slightly more than 1.

1
Step 1: Understand the definition of a probability density function (PDF). A valid PDF must satisfy two conditions: (1) The function must be non-negative for all values of x, and (2) The total area under the curve must equal 1.
Step 2: Analyze the graph provided. The orange curve is a horizontal line at y = 0.2 between x = 1 and x = 5. Outside this interval, the curve touches the x-axis, meaning the function is zero.
Step 3: Calculate the area under the curve. Since the curve is constant at y = 0.2 over the interval [1, 5], the area can be calculated using the formula for the area of a rectangle: Area = height × width. Here, height = 0.2 and width = 5 - 1 = 4.
Step 4: Verify if the total area equals 1. Substitute the values into the formula: Area = 0.2 × 4. Check if this result equals 1 to determine if the curve is a valid PDF.
Step 5: Conclude based on the calculation. If the area equals 1, the curve is a valid PDF. If the area does not equal 1, the curve is not a valid PDF.
Watch next
Master Uniform Distribution with a bite sized video explanation from Patrick
Start learningRelated Videos
Related Practice
Multiple Choice