A regional sales manager is forecasting sales for a new energy-efficient refrigerator. Based on market research she estimates that weekly sales will be uniformly distributed between 400 and 700 units. The company's operations team must decide how many units to stock per week to meet demand without overstocking. If they stock 550 units, find the probability of overstocking. If they want to have less than a 20% chance of overstocking, should they stock more or less than 550 units?
Table of contents
- 1. Introduction to Statistics53m
- 2. Describing Data with Tables and Graphs2h 2m
- 3. Describing Data Numerically2h 8m
- 4. Probability2h 26m
- 5. Binomial Distribution & Discrete Random Variables3h 28m
- 6. Normal Distribution & Continuous Random Variables2h 21m
- 7. Sampling Distributions & Confidence Intervals: Mean3h 37m
- Sampling Distribution of the Sample Mean and Central Limit Theorem19m
- Distribution of Sample Mean - Excel23m
- Introduction to Confidence Intervals22m
- Confidence Intervals for Population Mean1h 26m
- Determining the Minimum Sample Size Required12m
- Finding Probabilities and T Critical Values - Excel28m
- Confidence Intervals for Population Means - Excel25m
- 8. Sampling Distributions & Confidence Intervals: Proportion2h 20m
- 9. Hypothesis Testing for One Sample5h 15m
- Steps in Hypothesis Testing1h 13m
- Performing Hypothesis Tests: Means1h 1m
- Hypothesis Testing: Means - Excel42m
- Performing Hypothesis Tests: Proportions39m
- Hypothesis Testing: Proportions - Excel27m
- Performing Hypothesis Tests: Variance12m
- Critical Values and Rejection Regions29m
- Link Between Confidence Intervals and Hypothesis Testing12m
- Type I & Type II Errors16m
- 10. Hypothesis Testing for Two Samples5h 35m
- Two Proportions1h 12m
- Two Proportions Hypothesis Test - Excel28m
- Two Means - Unknown, Unequal Variance1h 2m
- Two Means - Unknown Variances Hypothesis Test - Excel12m
- Two Means - Unknown, Equal Variance15m
- Two Means - Unknown, Equal Variances Hypothesis Test - Excel9m
- Two Means - Known Variance12m
- Two Means - Sigma Known Hypothesis Test - Excel21m
- Two Means - Matched Pairs (Dependent Samples)42m
- Matched Pairs Hypothesis Test - Excel12m
- Two Variances and F Distribution29m
- Two Variances - Graphing Calculator15m
- 11. Correlation1h 24m
- 12. Regression3h 42m
- Linear Regression & Least Squares Method26m
- Residuals12m
- Coefficient of Determination12m
- Regression Line Equation and Coefficient of Determination - Excel8m
- Finding Residuals and Creating Residual Plots - Excel11m
- Inferences for Slope32m
- Enabling Data Analysis Toolpak1m
- Regression Readout of the Data Analysis Toolpak - Excel21m
- Prediction Intervals13m
- Prediction Intervals - Excel19m
- Multiple Regression - Excel29m
- Quadratic Regression23m
- Quadratic Regression - Excel10m
- 13. Chi-Square Tests & Goodness of Fit2h 31m
- 14. ANOVA2h 32m
6. Normal Distribution & Continuous Random Variables
Uniform Distribution
Struggling with Statistics for Business?
Join thousands of students who trust us to help them ace their exams!Watch the first videoMultiple Choice
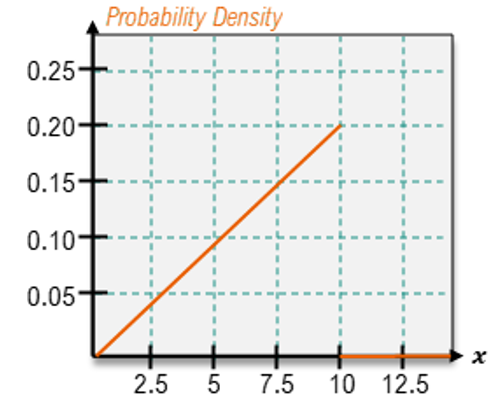
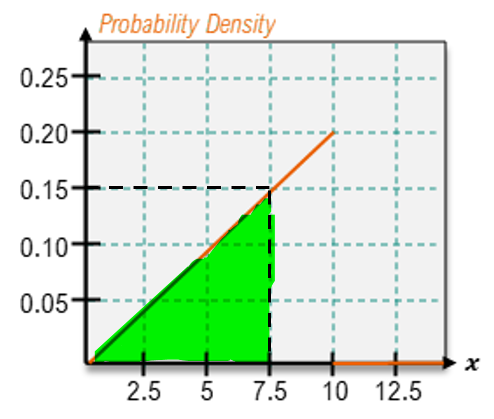
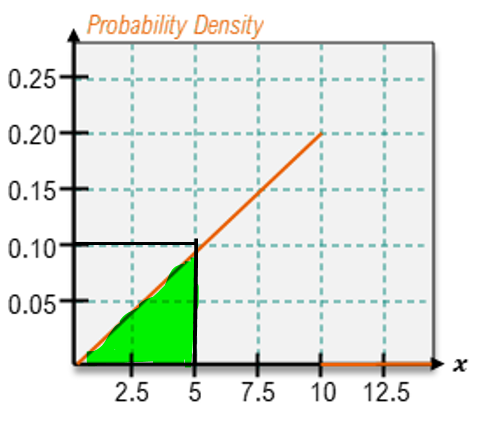
Shade the area corresponding to the probability listed, then find the probability.
P(X<7.5)

A

B

C

D

0 Comments
 Verified step by step guidance
1
Step 1: Identify the type of probability distribution represented in the graph. The graph shows a triangular probability density function (PDF), which is a continuous distribution. The area under the curve represents probabilities.
Step 2: Recognize that the problem asks for the probability P(X < 7.5). This corresponds to the shaded area under the curve from the leftmost point (x = 2.5) to x = 7.5.
Step 3: Break the shaded area into geometric shapes for calculation. The shaded region forms a triangle. The base of the triangle spans from x = 2.5 to x = 7.5, and the height corresponds to the value of the PDF at x = 7.5.
Step 4: Use the formula for the area of a triangle: Area = (1/2) × base × height. The base is (7.5 - 2.5) = 5, and the height can be determined from the graph as 0.15 (the value of the PDF at x = 7.5).
Step 5: Calculate the area using the formula. This area represents the probability P(X < 7.5). Substitute the values into the formula: Area = (1/2) × 5 × 0.15. This will give the probability value.

 6:06m
6:06mWatch next
Master Uniform Distribution with a bite sized video explanation from Patrick
Start learningRelated Videos
Related Practice
Multiple Choice
Uniform Distribution practice set


