Multiple Choice
Shade the area corresponding to the probability listed, then find the probability.
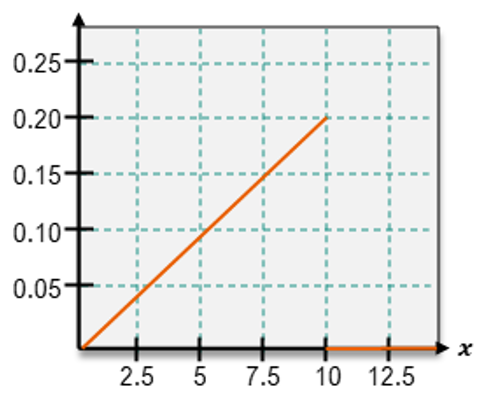
Yes, because the area under the curve =
No, because the area under the curve =
No, because probability density functions must be flat
Yes, because the area under the curve =
 Verified step by step guidance
 6:06m
6:06mMaster Uniform Distribution with a bite sized video explanation from Patrick
Start learning
