Back
BackProblem 12.2.7
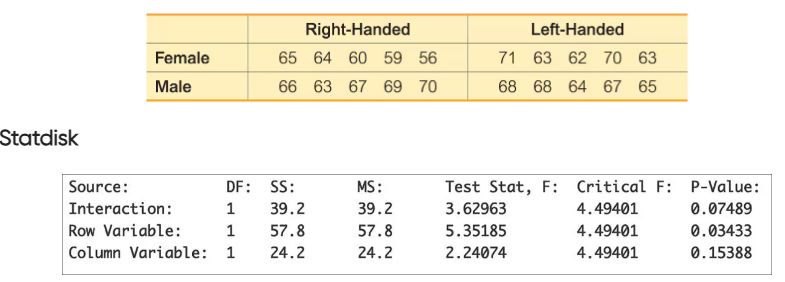
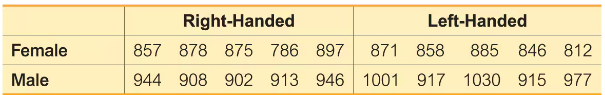
Distance Between Pupils The following table lists distances (mm) between pupils of randomly selected U.S. Army personnel collected as part of the ANSUR II study. Results from two-way analysis of variance are also shown. Use the displayed results and use a 0.05 significance level. What do you conclude? Are the results as you would expect?
Problem 12.2.4
Balanced Design Does the table given in Exercise 1 constitute a balanced design? Why or why not?
Problem 12.6
One-Way ANOVA In general, what is one-way analysis of variance used for?
Problem 12.1.2
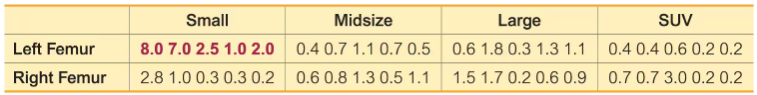
Two-Way Anova If we have a goal of using the data given in Exercise 1 to (1) determine whether the femur side (left, right) has an effect on the crash force measurements and (2) to determine whether the vehicle size has an effect on the crash force measurements, should we use one-way analysis of variance for the two individual tests? Why or why not?
Problem 12.1.17
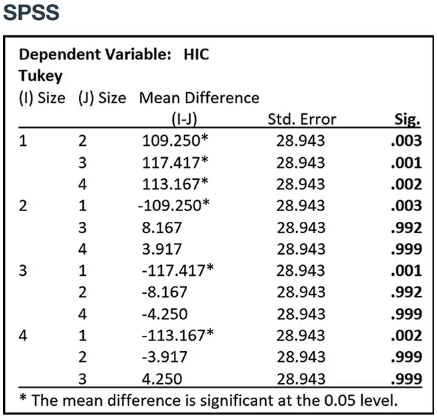
Tukey Test A display of the Bonferroni test results from Table 12-1 (which is part of the Chapter Problem) is provided here. Shown on the top of the next page is the SPSS-generated display of results from the Tukey test using the same data. Compare the Tukey test results to those from the Bonferroni test.
Problem 12.1.4
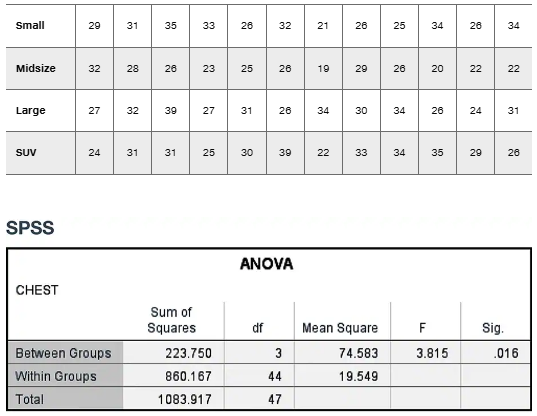
In Exercises 1–4, use the following listed measured amounts of chest compression (mm) from car crash tests (from Data Set 35 “Car Data” in Appendix B). Also shown are the SPSS results from analysis of variance. Assume that we plan to use a 0.05 significance level to test the claim that the different car sizes have the same mean amount of chest compression.
P-VALUE If we use a 0.05 significance level in analysis of variance with the sample data given in Exercise 1, what is the P-value? What should we conclude? If the four populations have means that do not appear to be the same, does the analysis of variance test enable us to identify which populations have means that are significantly different?
Problem 12.2.1
Two-Way Anova The measurements of crash test forces on the femur in Table 12-3 from Example 1 are reproduced below with fabricated measurement data (in red) used for the left femur in a small car. What characteristic of the data suggests that the appropriate method of analysis is two-way analysis of variance? That is, what is “two-way” about the data entered in this table?
Problem 12.2.9
Sitting Heights The sitting height of a person is the vertical distance between the sitting surface and the top of the head. The following table lists sitting heights (mm) of randomly selected U.S. Army personnel collected as part of the ANSUR II study. Using the data with a 0.05 significance level, what do you conclude? Are the results as you would expect?
Problem 12.2.8
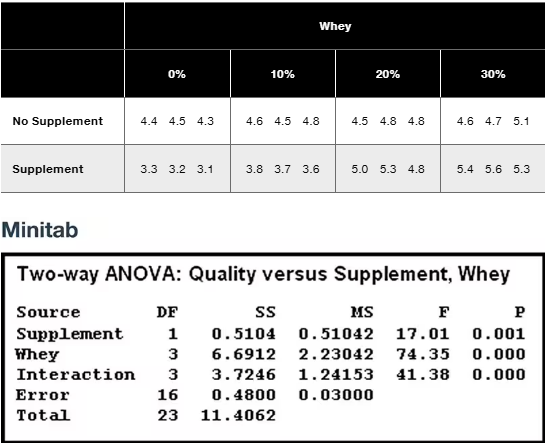
Pancake Experiment Listed below are ratings of pancakes made by experts (based on data from Minitab). Different pancakes were made with and without a supplement and with different amounts of whey. The results from two-way analysis of variance are shown. Use the displayed results and a 0.05 significance level. What do you conclude?
Problem 12.1.9
In Exercises 5–16, use analysis of variance for the indicated test.
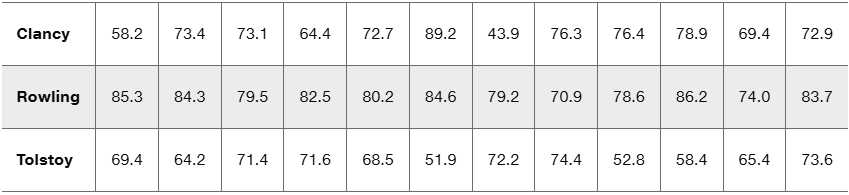
Clancy, Rowling, and Tolstoy Ease of Reading Pages were randomly selected from three books: The Bear and the Dragon by Tom Clancy, Harry Potter and the Sorcerer’s Stone by J.K. Rowling, and War and Peace by Leo Tolstoy. Listed below are Flesch Reading Ease Scores for those pages. Use a 0.05 significance level to test the claim that pages from books by those three authors have the same mean Flesch Reading Ease score. Given that higher scores correspond to text that is easier to read, which author appears to be different, and how is that author different?
Problem 12.2.6
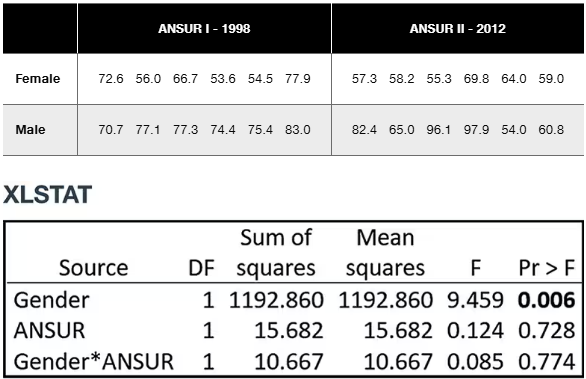
Weights from ANSUR I and ANSUR II The following table lists weights (kg) of randomly selected U.S. Army personnel obtained from the ANSUR I study conducted in 1988 and the ANSUR II study conducted in 2012. If we use the data with two-way analysis of variance and a 0.05 significance level, we get the accompanying display. What do you conclude?
Problem 12.2.5
Car Crash Test Measurements If we use the data given in Exercise 1 with two-way analysis of variance and a 0.05 significance level, we get the accompanying display. What do you conclude?
Problem 12.1.11
In Exercises 5–16, use analysis of variance for the indicated test.
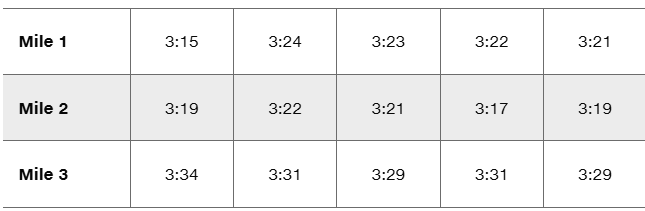
Triathlon Times Jeff Parent is a statistics instructor who participates in triathlons. Listed below are times (in minutes and seconds) he recorded while riding a bicycle for five stages through each mile of a 3-mile loop. Use a 0.05 significance level to test the claim that it takes the same time to ride each of the miles. Does one of the miles appear to have a hill?
Problem 12.1.2
In Exercises 1–4, use the following listed measured amounts of chest compression (mm) from car crash tests (from Data Set 35 “Car Data” in Appendix B). Also shown are the SPSS results from analysis of variance. Assume that we plan to use a 0.05 significance level to test the claim that the different car sizes have the same mean amount of chest compression.
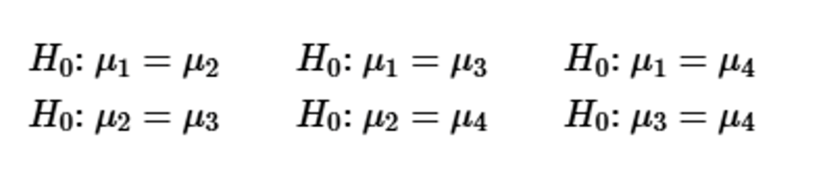
Why Not Test Two at a Time? Refer to the sample data given in Exercise 1. If we want to test for equality of the four means, why don’t we use the methods of Section 9-2 “Two Means: Independent Samples” for the following six separate hypothesis tests?
Problem 12.CQ.5
Cola Weights The displayed results from Exercise 1 are from one-way analysis of variance. What is it about this test that characterizes it as one-way analysis of variance instead of two-way analysis of variance?
Problem 12.CQ.1
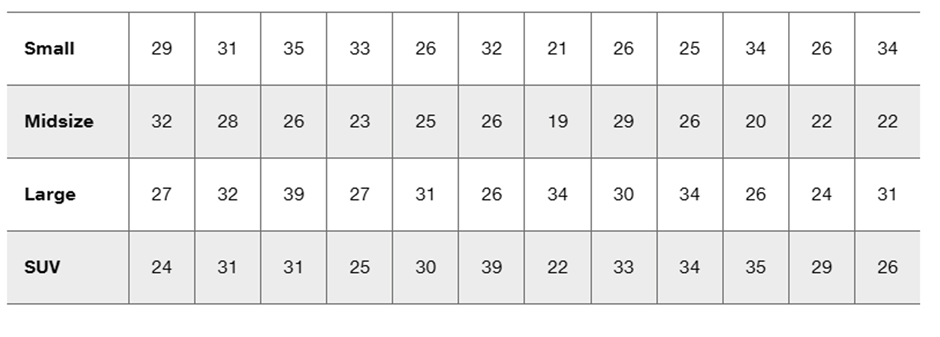
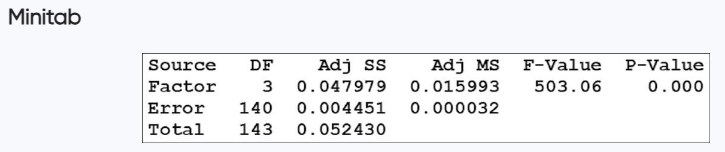
Cola Weights Data Set 37 “Cola Weights and Volumes” in Appendix B lists the weights (lb) of the contents of cans of cola from four different samples: (1) regular Coke, (2) Diet Coke, (3) regular Pepsi, and (4) Diet Pepsi. The results from analysis of variance are shown in the Minitab display below. What is the null hypothesis for this analysis of variance test? Based on the displayed results, what should you conclude about H_knot. What do you conclude about equality of the mean weights from the four samples?
Problem 12.CQ.2
Cola Weights For the four samples described in Exercise 1, the sample of regular Coke has a mean weight of 0.81682 lb, the sample of Diet Coke has a mean weight of 0.78479 lb, the sample of regular Pepsi has a mean weight of 0.82410 lb, and the sample of Diet Pepsi has a mean weight of 0.78386 lb. If we use analysis of variance and reach a conclusion to reject equality of the four sample means, can we then conclude that any of the specific samples have means that are significantly different from the others?
Problem 12.CR.3
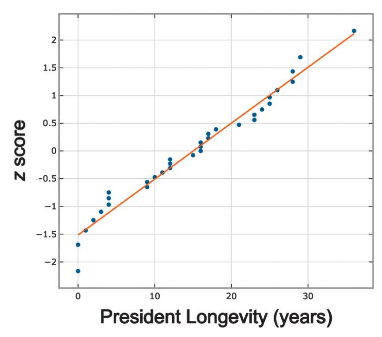
Normal Quantile Plot The accompanying normal quantile plot was obtained from the longevity times of presidents. What does this graph tell us?
Problem 12.CR.6b
Quarters Assume that weights of quarters minted after 1964 are normally distributed with a mean of 5.670 g and a standard deviation of 0.062 g (based on U.S. Mint specifications).
b. If 25 quarters are randomly selected, find the probability that their mean weight is greater than 5.675 g.
Problem 12.CRE.1e
In Exercises 1–5, refer to the following list of numbers of years that deceased U.S. presidents, popes, and British monarchs lived after their inauguration, election, or coronation, respectively. (As of this writing, the last president is George H. W. Bush, the last pope is John Paul II, and the last British monarch is George VI.) Assume that the data are samples from larger populations.
[Image]
Exploring the Data Include appropriate units in all answers.
e. What is the level of measurement of the data (nominal, ordinal, interval, ratio)?
Problem 12.CRE.8c
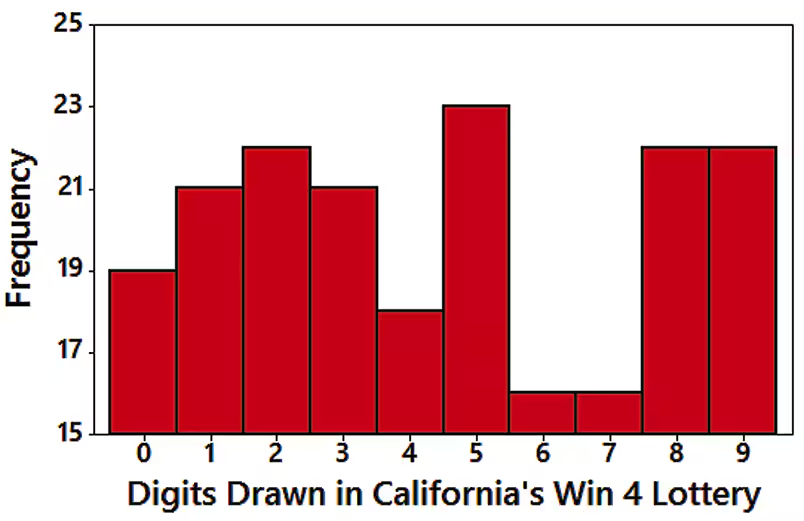
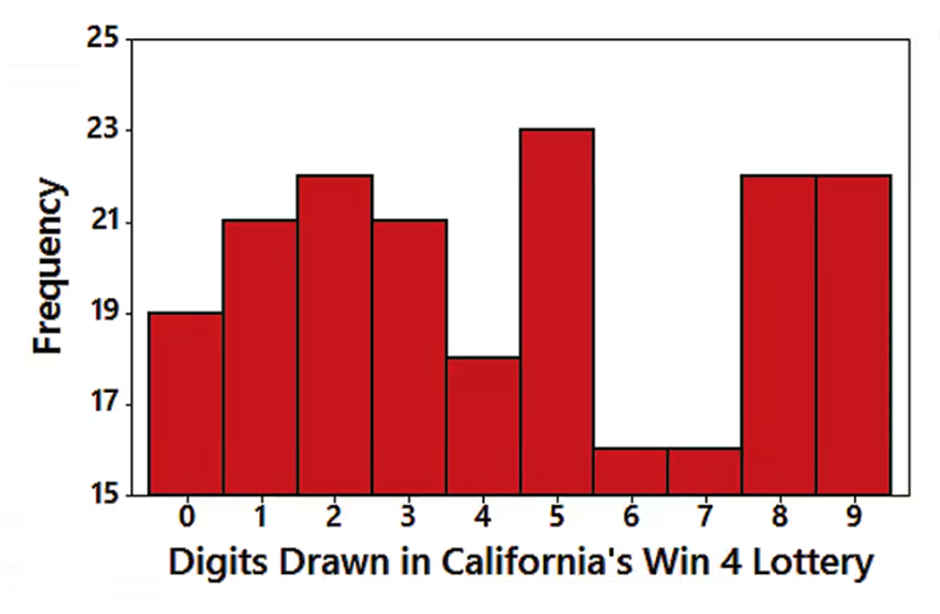
Win 4 Lottery Shown below is a histogram of digits selected in California’s Win 4 lottery. Each drawing involves the random selection (with replacement) of four digits between 0 and 9 inclusive.
c. Identify the frequencies, then test the claim that the digits are selected from a population in which the digits are all equally likely. Is there a problem with the lottery?
Problem 12.CRE.8
Win 4 Lottery Shown below is a histogram of digits selected in California’s Win 4 lottery. Each drawing involves the random selection (with replacement) of four digits between 0 and 9 inclusive.
b. Does the display depict a normal distribution? Why or why not? What should be the shape of the histogram?
Problem 12.Q.7
One vs. Two What is the fundamental difference between one-way analysis of variance and two-way analysis of variance?
Problem 12.Q.8
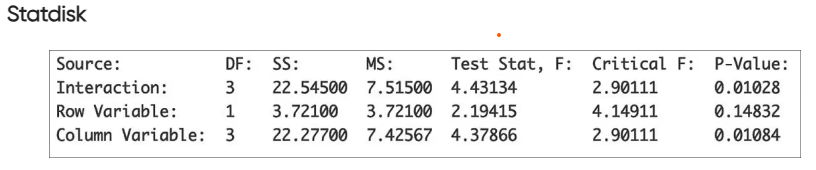
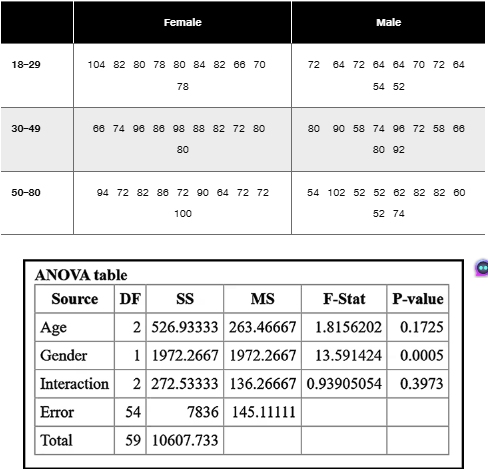
Pulse Rates Shown below are pulse rates from Data Set 1 “Body Data” in Appendix B, and the StatCrunch display from two-way analysis of variance of these data. In analyzing these data, what important feature is addressed with two-way analysis of variance that is not addressed with two separate tests of (1) difference between mean pulse rates based on gender, or (2) differences among the mean pulse rates in the different age brackets?
Problem 12.Q.9b
Interaction
b. If there does appear to be an interaction between gender and age bracket, how should we continue with the procedure for two-way analysis of variance?
Problem 12.Q.9a
"Interaction
a. Based on the display included with the preceding exercise, what do you conclude about an interaction between gender and age bracket?
Problem 12.Q.10
Gender and Age Bracket Based on the display included with Exercise 8, what are the final conclusions?
Problem 12.R.4
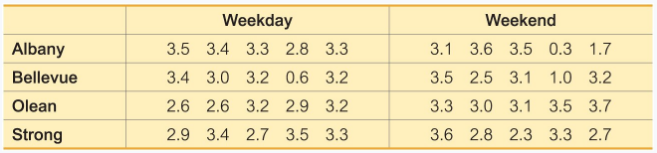
Birth Weights The table below lists some of the same data used in the preceding exercise, but the seven days of the week are combined into weekday (Monday, Tuesday, Wednesday, Thursday, Friday) and weekend days (Saturday, Sunday). Also, the birth weights are converted to kilograms. What do you conclude?
Problem 12.R.3
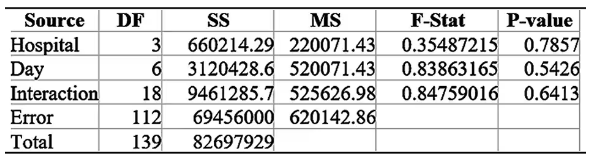
Birth Weights Data Set 6 “Births” includes birth weights (g), hospitals, and the day of the week that mothers were admitted to the hospital. Using rows to represent the four hospitals (Albany Medical Center, Bellevue Hospital Center, Olean General Hospital, Strong Memorial Hospital), and using columns to represent the seven different days of the week, a two-way table has 28 individual cells. Using five birth weights for each of those 28 cells and using StatCrunch for two-way analysis of variance, we get the results displayed below. What do you conclude?
Problem 12.2.11a
Transformations of Data Example 1 illustrated the use of two-way ANOVA to analyze the sample data in Table 12-3. How are the results affected in each of the following cases?
a. The same constant is added to each sample value.