Back
BackProblem 11.2.4
Right-Tailed, Left-Tailed, Two-Tailed Is the hypothesis test described in Exercise 1 right-tailed, left-tailed, or two-tailed? Explain your choice.
Problem 11.1.5
In Exercises 5–20, conduct the hypothesis test and provide the test statistic and the P-value and/or critical value, and state the conclusion.
Heights Measured or Reported? A random sample of the last digits of heights (in.) of males from Data Set 4 “Measured and Reported” is summarized in the table below. Use these last digits to determine whether they occur with about the same frequency. Use a 0.05 significance level. Do the corresponding heights appear to be measured or reported?
Problem 11.2.6
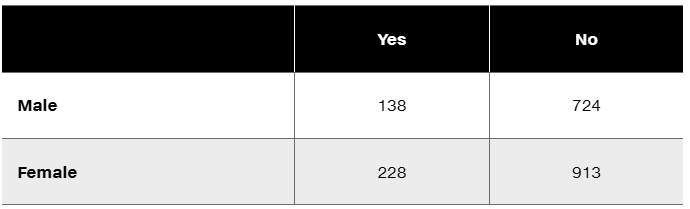
Ghosts The following table summarizes results from a Pew Research Center survey in which subjects were asked whether they had seen or been in the presence of a ghost. Use a 0.01 significance level to test the claim that gender is independent of response. Does the conclusion change if the significance level is changed to 0.05?
Problem 11.2.13
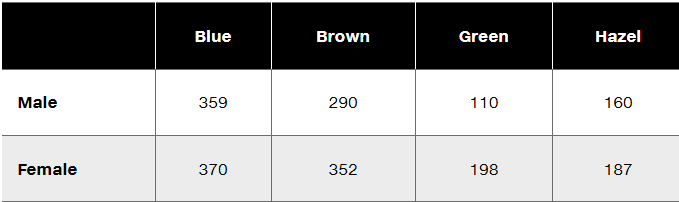
Gender and Eye Color The following table describes the distribution of eye colors reported by male and female statistics students (based on data from “Does Eye Color Depend on Gender? It Might Depend on Who or How You Ask,” by Froelich and Stephenson, Journal of Statistics Education, Vol. 21, No. 2). Is there sufficient evidence to warrant rejection of the belief that gender and eye color are independent traits? Use a 0.01 significance level.
Problem 11.2.8
Accuracy of Fingerprint Identifications An experiment was conducted to compare the accuracy of fingerprint experts to the accuracy of novices (based on data from “Identifying Fingerprint Expertise,” by Tangen, Thompson, and McCarthy, Psychological Science, Vol. 22, No. 8). The data in the table are based on trials in which the evaluators were given matching fingerprints. Use a 0.05 significance level to determine whether correct identification is independent of whether the evaluator is an expert or a novice.
Problem 11.1.8
In Exercises 5–20, conduct the hypothesis test and provide the test statistic and the P-value and/or critical value, and state the conclusion.
Flat Tire and Missed Class A classic story involves four carpooling students who missed a test and gave as an excuse a flat tire. On the makeup test, the instructor asked the students to identify the particular tire that went flat. If they really didn’t have a flat tire, would they be able to identify the same tire? The author asked 41 other students to identify the tire they would select. The results are listed in the following table (except for one student who selected the spare). Use a 0.05 significance level to test the author’s claim that the results fit a uniform distribution. What does the result suggest about the likelihood of four students identifying the same tire when they really didn’t have a flat?
Problem 11.2.15
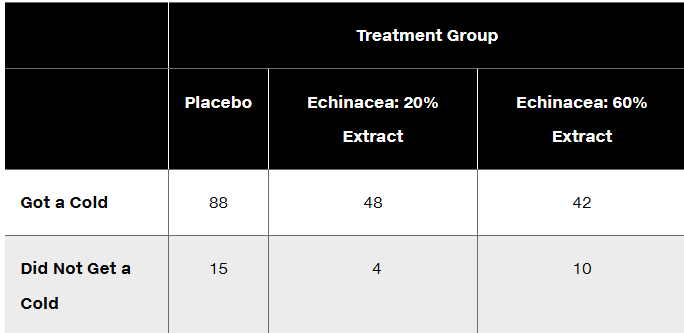
Clinical Trial of Echinacea In a clinical trial of the effectiveness of echinacea for preventing colds, the results in the table below were obtained (based on data from “An Evaluation of Echinacea Angustifolia in Experimental Rhinovirus Infections,” by Turner et al., New England Journal of Medicine, Vol. 353, No. 4). Use a 0.05 significance level to test the claim that getting a cold is independent of the treatment group. What do the results suggest about the effectiveness of echinacea as a prevention against colds?
Problem 11.2.21
Equivalent Tests A x^2 test involving a 2 x 2 table is equivalent to the test for the difference between two proportions, as described in Section 9-1. Using Table 11-1 from the Chapter Problem, verify that the x^2 test statistic and the z test statistic (found from the test of equality of two proportions) are related as follows: z^2 = x^2 Also show that the critical values have that same relationship.
Problem 11.1.21
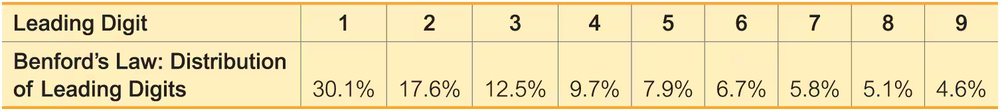
Benford’s Law
According to Benford’s law, a variety of different data sets include numbers with leading (first) digits that follow the distribution shown in the table below. In Exercises 21–24, test for goodness-of-fit with the distribution described by Benford’s law.
Detecting Fraud When working for the Brooklyn district attorney, investigator Robert Burton analyzed the leading digits of the amounts from 784 checks issued by seven suspect companies. The frequencies were found to be 0, 15, 0, 76, 479, 183, 8, 23, and 0, and those digits correspond to the leading digits of 1, 2, 3, 4, 5, 6, 7, 8, and 9, respectively. If the observed frequencies are substantially different from the frequencies expected with Benford’s law, the check amounts appear to result from fraud. Use a 0.01 significance level to test for goodness-of-fit with Benford’s law. Does it appear that the checks are the result of fraud?
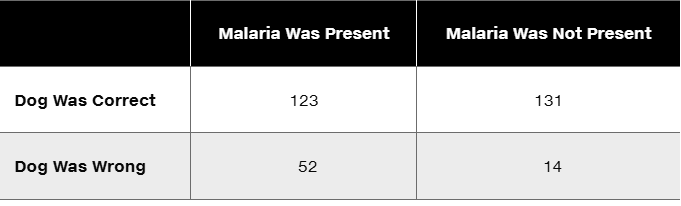
Problem 11.2.1
Dogs Detecting Malaria The following table lists results from an experiment designed to test the ability of dogs to use their extraordinary sense of smell to detect malaria in samples of children’s socks (based on data presented at an annual meeting of the American Society of Tropical Medicine, by principal investigator Steve Lindsay). Assuming that the dog being correct is independent of whether malaria is present, find the expected value for the observed frequency of 123.
Problem 11.1.6
In Exercises 5–20, conduct the hypothesis test and provide the test statistic and the P-value and/or critical value, and state the conclusion.
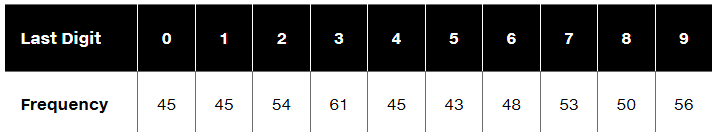
Heights Measured or Reported? Repeat the preceding exercise using the frequencies in the following table, which summarizes all of the 2784 male heights listed in Data Set 4 “Measured and Reported.” Does the larger data set have much of an effect on the results from Exercise 5?
Problem 11.1.9
In Exercises 5–20, conduct the hypothesis test and provide the test statistic and the P-value and/or critical value, and state the conclusion.
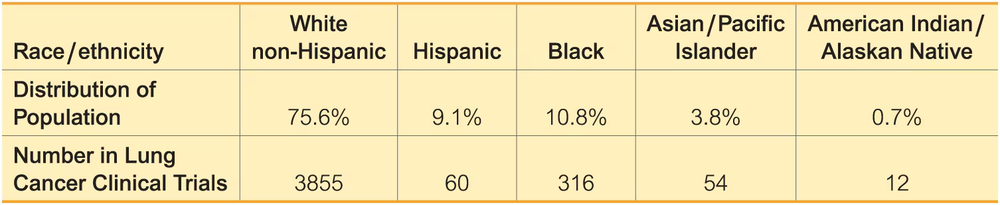
Bias in Clinical Trials? Researchers investigated the issue of race and equality of access to clinical trials. The following table shows the population distribution and the numbers of participants in clinical trials involving lung cancer (based on data from “Participation in Cancer Clinical Trials,” by Murthy, Krumholz, and Gross, Journal of the American Medical Association, Vol. 291, No. 22). Use a 0.01 significance level to test the claim that the distribution of clinical trial participants fits well with the population distribution. Is there a race/ethnic group that appears to be very underrepresented?
Problem 11.2.2
Identifying Hypotheses Refer to the data given in Exercise 1 and assume that the requirements are all satisfied and we want to conduct a hypothesis test of independence using the methods of this section. Identify the null and alternative hypotheses.
Problem 11.1.7
In Exercises 5–20, conduct the hypothesis test and provide the test statistic and the P-value and/or critical value, and state the conclusion.
Testing a Slot Machine The author purchased a slot machine (Bally Model 809) and tested it by playing it 1197 times. There are 10 different categories of outcomes, including no win, win jackpot, win with three bells, and so on. When testing the claim that the observed outcomes agree with the expected frequencies, the author obtained a test statistic of x2 = 8.815 Use a 0.05 significance level to test the claim that the actual outcomes agree with the expected frequencies. Does the slot machine appear to be functioning as expected?
Problem 11.CQQ.10
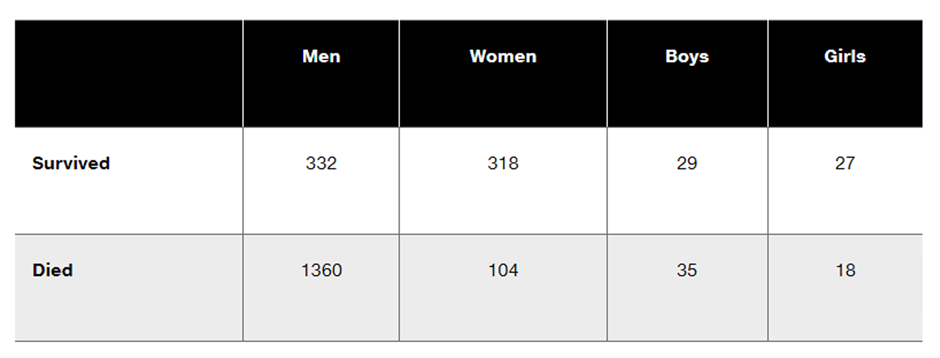
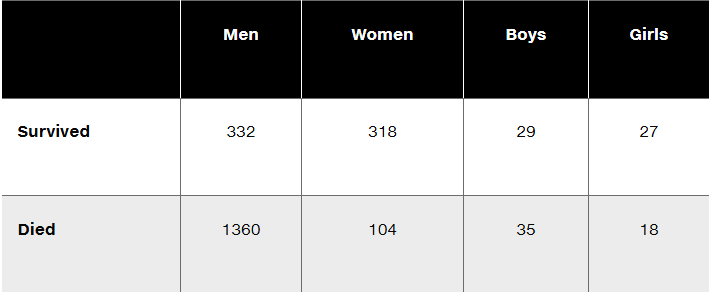
Questions 6–10 refer to the sample data in the following table, which describes the fate of the passengers and crew aboard the Titanic when it sank on April 15, 1912. Assume that the data are a sample from a large population and we want to use a 0.05 significance level to test the claim that surviving is independent of whether the person is a man, woman, boy, or girl.
Given that the P-value for the hypothesis test is 0.000 when rounded to three decimal places, what do you conclude? What do the results indicate about the rule that women and children should be the first to be saved?
Problem 11.RE.4
Does the Treatment Affect Success? The following table lists frequencies of successes and failures for different treatments used for a stress fracture in a foot bone (based on data from “Surgery Unfounded for Tarsal Navicular Stress Fracture,” by Bruce Jancin, Internal Medicine News, Vol. 42, No. 14). Use a 0.05 significance level to test the claim that success of the treatment is independent of the type of treatment. What does the result indicate about the increasing trend to use surgery?
Problem 11.RE.1
Weather-Related Deaths For the most recent year as of this writing, the numbers of weather-related U.S. deaths for each month were 61, 14, 22, 26, 29, 42, 93, 49, 47, 35, 96, 16, listed in order beginning with January (based on data from the National Weather Service). Use a 0.01 significance level to test the claim that weather-related deaths occur in the different months with the same frequency. Provide an explanation for the result.
Problem 11.1.25a
Testing Goodness-of-Fit with a Normal Distribution Refer to Data Set 1 “Body Data” in Appendix B for the heights of females.
a. Enter the observed frequencies in the table above.
Problem 11.1.1a
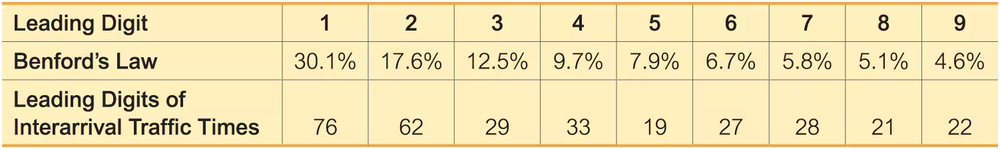
Cybersecurity The table below lists the frequency of leading digits of Internet traffic interarrival times for a computer, along with the percentages of each leading digit expected with Benford’s law.
a. Identify the general notation used for observed and expected values.
Problem 11.1.25b
Testing Goodness-of-Fit with a Normal Distribution Refer to Data Set 1 “Body Data” in Appendix B for the heights of females.
b. Assuming a normal distribution with mean and standard deviation given by the sample mean and standard deviation, use the methods of Chapter 6 to find the probability of a randomly selected height belonging to each class.
Problem 11.1.1b
Cybersecurity The table below lists the frequency of leading digits of Internet traffic interarrival times for a computer, along with the percentages of each leading digit expected with Benford’s law.
b. Identify the observed and expected values for the leading digit of 2.
Problem 11.1.1c
Cybersecurity The table below lists the frequency of leading digits of Internet traffic interarrival times for a computer, along with the percentages of each leading digit expected with Benford’s law.
c. Use the results from part (b) to find the contribution to the x2 test statistic from the category representing the leading digit of 2.
Problem 11.1.25c
Testing Goodness-of-Fit with a Normal Distribution Refer to Data Set 1 “Body Data” in Appendix B for the heights of females.
c. Using the probabilities found in part (b), find the expected frequency for each category.
Problem 11.q.1
Exercises 1–5 refer to the sample data in the following table, which summarizes the frequencies of 500 digits randomly generated by Statdisk. Assume that we want to use a 0.05 significance level to test the claim that Statdisk generates the digits in a way that they are equally likely.
What are the null and alternative hypotheses corresponding to the stated claim?
Problem 11.q.8
Questions 6–10 refer to the sample data in the following table, which describes the fate of the passengers and crew aboard the Titanic when it sank on April 15, 1912. Assume that the data are a sample from a large population and we want to use a 0.05 significance level to test the claim that surviving is independent of whether the person is a man, woman, boy, or girl.
Is the hypothesis test left-tailed, right-tailed, or two-tailed?
Problem 11.q.7
Questions 6–10 refer to the sample data in the following table, which describes the fate of the passengers and crew aboard the Titanic when it sank on April 15, 1912. Assume that the data are a sample from a large population and we want to use a 0.05 significance level to test the claim that surviving is independent of whether the person is a man, woman, boy, or girl.
What distribution is used to test the stated claim (normal, t, F, chi-square, uniform)?
Problem 11.q.3
Exercises 1–5 refer to the sample data in the following table, which summarizes the frequencies of 500 digits randomly generated by Statdisk. Assume that we want to use a 0.05 significance level to test the claim that Statdisk generates the digits in a way that they are equally likely.
Is the hypothesis test left-tailed, right-tailed, or two-tailed?
Problem 11.q.6
Questions 6–10 refer to the sample data in the following table, which describes the fate of the passengers and crew aboard the Titanic when it sank on April 15, 1912. Assume that the data are a sample from a large population and we want to use a 0.05 significance level to test the claim that surviving is independent of whether the person is a man, woman, boy, or girl.
Identify the null and alternative hypotheses corresponding to the stated claim.
Problem 11.q.9
Questions 6–10 refer to the sample data in the following table, which describes the fate of the passengers and crew aboard the Titanic when it sank on April 15, 1912. Assume that the data are a sample from a large population and we want to use a 0.05 significance level to test the claim that surviving is independent of whether the person is a man, woman, boy, or girl.
Find the number of degrees of freedom.