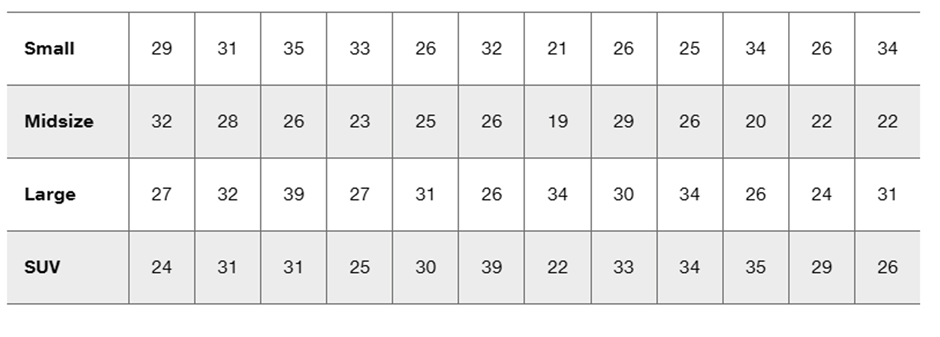
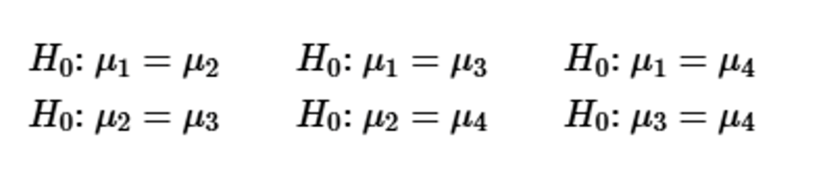
Sitting Heights The sitting height of a person is the vertical distance between the sitting surface and the top of the head. The following table lists sitting heights (mm) of randomly selected U.S. Army personnel collected as part of the ANSUR II study. Using the data with a 0.05 significance level, what do you conclude? Are the results as you would expect?
Table of contents
- 1. Intro to Stats and Collecting Data55m
- 2. Describing Data with Tables and Graphs1h 55m
- 3. Describing Data Numerically1h 45m
- 4. Probability2h 16m
- 5. Binomial Distribution & Discrete Random Variables2h 33m
- 6. Normal Distribution and Continuous Random Variables1h 38m
- 7. Sampling Distributions & Confidence Intervals: Mean1h 53m
- 8. Sampling Distributions & Confidence Intervals: Proportion1h 12m
- 9. Hypothesis Testing for One Sample2h 19m
- 10. Hypothesis Testing for Two Samples3h 22m
- 11. Correlation1h 6m
- 12. Regression1h 4m
- 13. Chi-Square Tests & Goodness of Fit1h 20m
- 14. ANOVA1h 0m
9. Hypothesis Testing for One Sample
Steps in Hypothesis Testing
Problem 12.1.2
Textbook Question
In Exercises 1–4, use the following listed measured amounts of chest compression (mm) from car crash tests (from Data Set 35 “Car Data” in Appendix B). Also shown are the SPSS results from analysis of variance. Assume that we plan to use a 0.05 significance level to test the claim that the different car sizes have the same mean amount of chest compression.

Why Not Test Two at a Time? Refer to the sample data given in Exercise 1. If we want to test for equality of the four means, why don’t we use the methods of Section 9-2 “Two Means: Independent Samples” for the following six separate hypothesis tests?


1
Step 1: Understand the problem. The goal is to test the claim that the four car sizes (Small, Midsize, Large, SUV) have the same mean amount of chest compression using a significance level of 0.05. The question asks why we don't use six separate hypothesis tests for pairwise comparisons of the means.
Step 2: Recognize the issue with multiple hypothesis tests. Performing six separate tests for pairwise comparisons (as shown in the hypotheses H₀: μ₁ = μ₂, H₀: μ₁ = μ₃, etc.) increases the risk of Type I error. This means the probability of incorrectly rejecting a true null hypothesis increases with the number of tests conducted.
Step 3: Introduce the concept of ANOVA (Analysis of Variance). ANOVA is a statistical method designed to test for equality of means across multiple groups simultaneously. It controls the overall Type I error rate and is more efficient than conducting multiple pairwise tests.
Step 4: Explain the mechanics of ANOVA. ANOVA compares the variability between group means to the variability within groups. If the between-group variability is significantly larger than the within-group variability, we reject the null hypothesis that all group means are equal. The test statistic is based on the F-distribution.
Step 5: Highlight the advantage of ANOVA. By using ANOVA, we can test the equality of all four means in a single test, avoiding the need for six separate tests and reducing the risk of inflated Type I error. If ANOVA indicates significant differences, post-hoc tests (like Tukey's HSD) can be used to identify which specific means differ.

This video solution was recommended by our tutors as helpful for the problem above
Video duration:
3mPlay a video:
Was this helpful?
Key Concepts
Here are the essential concepts you must grasp in order to answer the question correctly.
Analysis of Variance (ANOVA)
ANOVA is a statistical method used to test differences between two or more group means. It helps determine if at least one group mean is significantly different from the others, which is essential when comparing multiple groups, such as different car sizes in this case. By using ANOVA, we can avoid the increased risk of Type I error that occurs when conducting multiple t-tests.
Recommended video:
Guided course
Variance & Standard Deviation of Discrete Random Variables
Null Hypothesis
The null hypothesis is a statement that there is no effect or no difference, serving as a starting point for statistical testing. In this context, the null hypothesis posits that the mean chest compression is the same across all car sizes. Testing this hypothesis allows researchers to determine if observed differences in means are statistically significant or due to random chance.
Recommended video:
Guided course
Step 1: Write Hypotheses
Significance Level
The significance level, often denoted as alpha (α), is the threshold for determining whether to reject the null hypothesis. A common significance level is 0.05, indicating a 5% risk of concluding that a difference exists when there is none. In this scenario, using a 0.05 significance level means that if the p-value from the ANOVA test is less than 0.05, we would reject the null hypothesis and conclude that at least one car size has a different mean chest compression.
Recommended video:
Guided course
Step 4: State Conclusion Example 4
Watch next
Master Step 1: Write Hypotheses with a bite sized video explanation from Patrick
Start learningRelated Videos
Related Practice
Textbook Question