Here are the essential concepts you must grasp in order to answer the question correctly.
Interaction Graphs
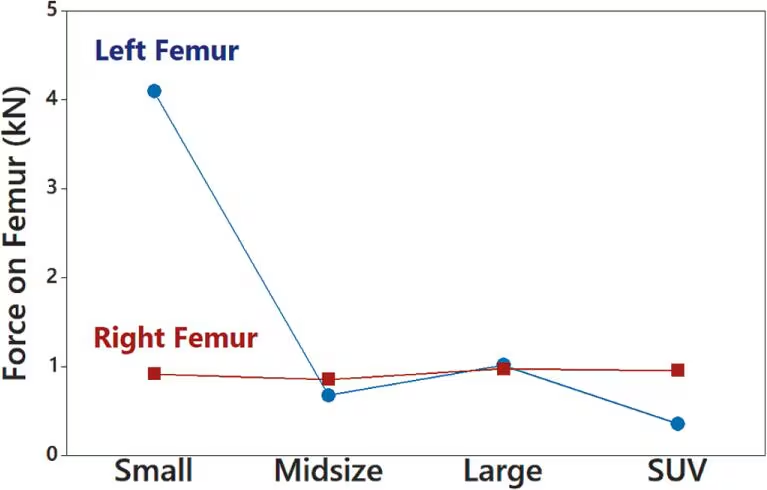
Interaction graphs visually represent the relationship between two or more variables, showing how one variable affects another across different conditions. In this case, the graph illustrates the force exerted on the left and right femur across various vehicle sizes, highlighting differences in impact based on the type of vehicle.
Recommended video:
Creating Time-Series Graphs
Force Measurement
Force is a vector quantity that causes an object to undergo a change in motion, measured in kilonewtons (kN) in this context. Understanding how force is distributed across the left and right femur helps in analyzing the safety and impact of different vehicle sizes on human anatomy during collisions.
Recommended video:
Visualizing Qualitative vs. Quantitative Data
Comparative Analysis
Comparative analysis involves evaluating the differences and similarities between two or more groups or conditions. In this graph, comparing the forces on the left and right femur across different vehicle sizes allows for insights into how vehicle design may influence injury risk in accidents.
Recommended video:
Comparing Mean vs. Median