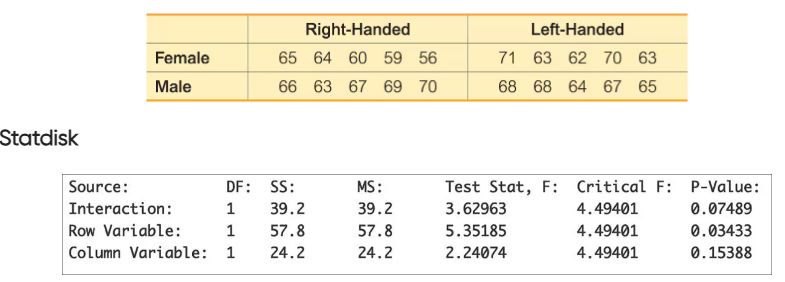
Two-Way Anova The measurements of crash test forces on the femur in Table 12-3 from Example 1 are reproduced below with fabricated measurement data (in red) used for the left femur in a small car. What characteristic of the data suggests that the appropriate method of analysis is two-way analysis of variance? That is, what is “two-way” about the data entered in this table?
Table of contents
- 1. Intro to Stats and Collecting Data55m
- 2. Describing Data with Tables and Graphs1h 55m
- 3. Describing Data Numerically1h 45m
- 4. Probability2h 16m
- 5. Binomial Distribution & Discrete Random Variables2h 33m
- 6. Normal Distribution and Continuous Random Variables1h 38m
- 7. Sampling Distributions & Confidence Intervals: Mean1h 53m
- 8. Sampling Distributions & Confidence Intervals: Proportion1h 12m
- 9. Hypothesis Testing for One Sample2h 19m
- 10. Hypothesis Testing for Two Samples3h 22m
- 11. Correlation1h 6m
- 12. Regression1h 4m
- 13. Chi-Square Tests & Goodness of Fit1h 20m
- 14. ANOVA1h 0m
9. Hypothesis Testing for One Sample
Steps in Hypothesis Testing
Problem 12.2.7
Textbook Question
Distance Between Pupils The following table lists distances (mm) between pupils of randomly selected U.S. Army personnel collected as part of the ANSUR II study. Results from two-way analysis of variance are also shown. Use the displayed results and use a 0.05 significance level. What do you conclude? Are the results as you would expect?


1
Step 1: Understand the problem. The table shows distances (in mm) between pupils for U.S. Army personnel categorized by gender (Female/Male) and handedness (Right-Handed/Left-Handed). The ANOVA results are provided to test for interaction effects, row effects (gender), and column effects (handedness) at a significance level of 0.05.
Step 2: Analyze the interaction effect. Look at the 'Interaction' row in the ANOVA table. The p-value is 0.07489, which is greater than the significance level of 0.05. This indicates that there is no statistically significant interaction between gender and handedness.
Step 3: Analyze the row variable (gender). The p-value for the 'Row Variable' is 0.03433, which is less than the significance level of 0.05. This suggests that gender has a statistically significant effect on the distance between pupils.
Step 4: Analyze the column variable (handedness). The p-value for the 'Column Variable' is 0.15388, which is greater than the significance level of 0.05. This indicates that handedness does not have a statistically significant effect on the distance between pupils.
Step 5: Conclude the findings. Based on the analysis, gender significantly affects pupil distance, but handedness does not. Additionally, there is no significant interaction between gender and handedness. These results align with expectations if gender differences in physical characteristics are known to influence pupil distance.

This video solution was recommended by our tutors as helpful for the problem above
Video duration:
6mPlay a video:
Was this helpful?
Key Concepts
Here are the essential concepts you must grasp in order to answer the question correctly.
Two-Way ANOVA
Two-way ANOVA (Analysis of Variance) is a statistical method used to determine the effect of two independent categorical variables on a continuous dependent variable. It assesses not only the individual impact of each factor but also the interaction between them. In this case, the factors are handedness (right-handed vs. left-handed) and gender (male vs. female), and the dependent variable is the distance between pupils.
Recommended video:
Guided course
Probabilities Between Two Values
F-Statistic
The F-statistic is a ratio used in ANOVA to compare the variance between group means to the variance within the groups. A higher F-statistic indicates a greater degree of variance between the groups relative to the variance within the groups, suggesting that at least one group mean is significantly different. In the provided results, the F-statistics for the interaction, row, and column variables help determine the significance of the effects.
Recommended video:
Guided course
Parameters vs. Statistics
P-Value
The p-value is a measure that helps determine the statistical significance of the results obtained from an ANOVA test. It indicates the probability of observing the data, or something more extreme, if the null hypothesis is true. A p-value less than the significance level (0.05 in this case) suggests that the null hypothesis can be rejected, indicating a significant effect of the factors being studied. The provided p-values for the interaction, row, and column variables guide the conclusions drawn from the analysis.
Recommended video:
Guided course
Step 3: Get P-Value
Watch next
Master Step 1: Write Hypotheses with a bite sized video explanation from Patrick
Start learningRelated Videos
Related Practice
Textbook Question