Textbook Question
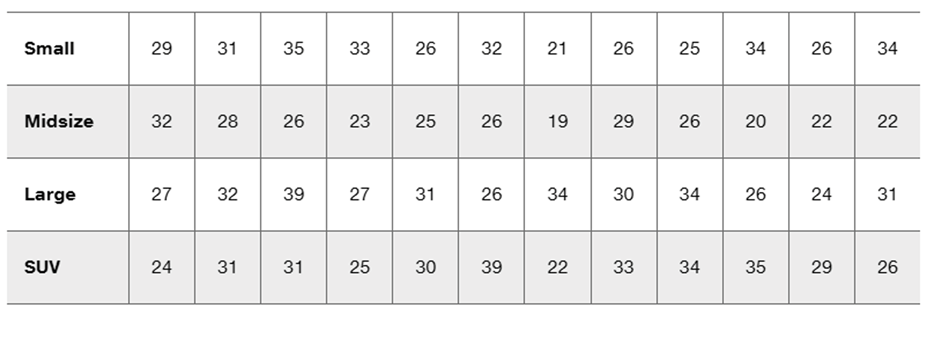
Balanced Design Does the table given in Exercise 1 constitute a balanced design? Why or why not?
 Verified step by step guidanceVerified video answer for a similar problem:
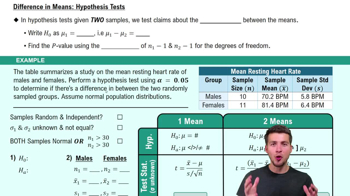
 08:24
08:24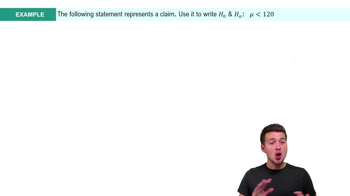 01:35
01:35 04:46
04:46 6:21m
6:21mMaster Step 1: Write Hypotheses with a bite sized video explanation from Patrick
Start learning