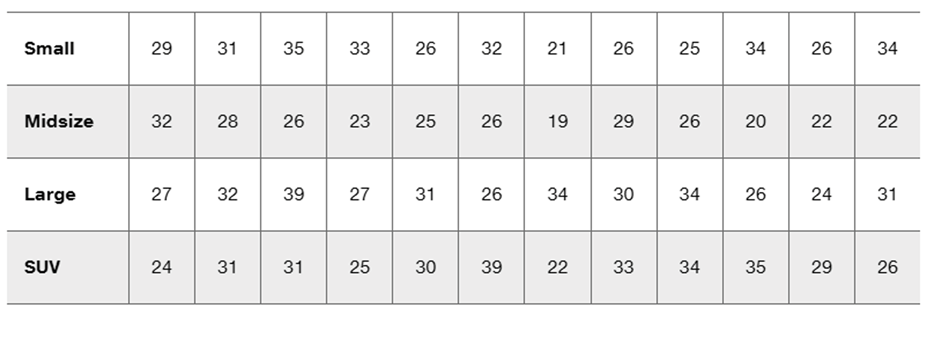
Distance Between Pupils The following table lists distances (mm) between pupils of randomly selected U.S. Army personnel collected as part of the ANSUR II study. Results from two-way analysis of variance are also shown. Use the displayed results and use a 0.05 significance level. What do you conclude? Are the results as you would expect?
Table of contents
- 1. Intro to Stats and Collecting Data55m
- 2. Describing Data with Tables and Graphs1h 55m
- 3. Describing Data Numerically1h 45m
- 4. Probability2h 16m
- 5. Binomial Distribution & Discrete Random Variables2h 33m
- 6. Normal Distribution and Continuous Random Variables1h 38m
- 7. Sampling Distributions & Confidence Intervals: Mean1h 53m
- 8. Sampling Distributions & Confidence Intervals: Proportion1h 12m
- 9. Hypothesis Testing for One Sample2h 19m
- 10. Hypothesis Testing for Two Samples3h 22m
- 11. Correlation1h 6m
- 12. Regression1h 4m
- 13. Chi-Square Tests & Goodness of Fit1h 20m
- 14. ANOVA1h 0m
9. Hypothesis Testing for One Sample
Steps in Hypothesis Testing
Problem 12.1.1b
Textbook Question
In Exercises 1–4, use the following listed measured amounts of chest compression (mm) from car crash tests (from Data Set 35 “Car Data” in Appendix B). Also shown are the SPSS results from analysis of variance. Assume that we plan to use a 0.05 significance level to test the claim that the different car sizes have the same mean amount of chest compression.

Anova
b. If the objective is to test the claim that the four car sizes have the same mean chest compression, why is the method referred to as analysis of variance?

1
Step 1: Understand the problem. The goal is to test the claim that the four car sizes (Small, Midsize, Large, SUV) have the same mean chest compression using a 0.05 significance level. The method used is analysis of variance (ANOVA).
Step 2: Recognize why the method is called analysis of variance. ANOVA is used to compare means of multiple groups by analyzing the variability within each group and between groups. It determines if the observed differences in sample means are statistically significant.
Step 3: Organize the data. The table provides chest compression measurements for four car sizes. Each row corresponds to a car size, and each column represents a measurement. Calculate the mean and variance for each group (Small, Midsize, Large, SUV).
Step 4: Perform ANOVA. Compute the between-group variance (how much the group means differ from the overall mean) and the within-group variance (how much individual measurements differ within each group). Use these variances to calculate the F-statistic.
Step 5: Compare the F-statistic to the critical value at the 0.05 significance level. If the F-statistic exceeds the critical value, reject the null hypothesis that all group means are equal. Otherwise, fail to reject the null hypothesis.

This video solution was recommended by our tutors as helpful for the problem above
Video duration:
3mPlay a video:
Was this helpful?
Key Concepts
Here are the essential concepts you must grasp in order to answer the question correctly.
Analysis of Variance (ANOVA)
ANOVA is a statistical method used to compare the means of three or more groups to determine if at least one group mean is significantly different from the others. It assesses the impact of one or more factors by comparing the variance within groups to the variance between groups. In this context, it helps to test the claim that different car sizes have the same mean amount of chest compression.
Recommended video:
Guided course
Variance & Standard Deviation of Discrete Random Variables
Null Hypothesis
The null hypothesis is a statement that there is no effect or no difference, and it serves as the default assumption in hypothesis testing. In this case, the null hypothesis would state that the mean chest compression measurements for small, midsize, large, and SUV cars are equal. The goal of the ANOVA test is to determine whether there is enough evidence to reject this null hypothesis.
Recommended video:
Guided course
Step 1: Write Hypotheses
Significance Level
The significance level, often denoted as alpha (α), is the threshold for determining whether a result is statistically significant. In this scenario, a significance level of 0.05 indicates that there is a 5% risk of concluding that a difference exists when there is none. If the p-value obtained from the ANOVA test is less than 0.05, it suggests that the means of the car sizes are significantly different.
Recommended video:
Guided course
Step 4: State Conclusion Example 4
Watch next
Master Step 1: Write Hypotheses with a bite sized video explanation from Patrick
Start learningRelated Videos
Related Practice
Textbook Question