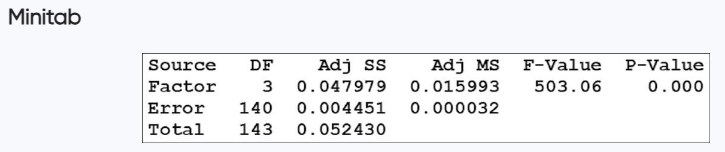
Arsenic in Rice Listed below are amounts of arsenic in samples of brown rice from three different states. The amounts are in micrograms of arsenic and all samples have the same serving size. The data are from the Food and Drug Administration. Use a 0.01 significance level to test the claim that the three samples are from populations with the same median.
Table of contents
- 1. Intro to Stats and Collecting Data55m
- 2. Describing Data with Tables and Graphs1h 55m
- 3. Describing Data Numerically1h 45m
- 4. Probability2h 16m
- 5. Binomial Distribution & Discrete Random Variables2h 33m
- 6. Normal Distribution and Continuous Random Variables1h 38m
- 7. Sampling Distributions & Confidence Intervals: Mean1h 53m
- 8. Sampling Distributions & Confidence Intervals: Proportion1h 12m
- 9. Hypothesis Testing for One Sample2h 19m
- 10. Hypothesis Testing for Two Samples3h 22m
- 11. Correlation1h 6m
- 12. Regression1h 4m
- 13. Chi-Square Tests & Goodness of Fit1h 20m
- 14. ANOVA1h 0m
9. Hypothesis Testing for One Sample
Steps in Hypothesis Testing
Problem 12.CQ.2
Textbook Question
Cola Weights For the four samples described in Exercise 1, the sample of regular Coke has a mean weight of 0.81682 lb, the sample of Diet Coke has a mean weight of 0.78479 lb, the sample of regular Pepsi has a mean weight of 0.82410 lb, and the sample of Diet Pepsi has a mean weight of 0.78386 lb. If we use analysis of variance and reach a conclusion to reject equality of the four sample means, can we then conclude that any of the specific samples have means that are significantly different from the others?


1
Step 1: Understand the context of the problem. The question asks whether rejecting the equality of the four sample means using analysis of variance (ANOVA) implies that specific sample means are significantly different from each other. ANOVA tests whether there is a significant difference among group means, but it does not specify which groups differ.
Step 2: Review the ANOVA table provided. The table shows the F-value (503.06) and the P-value (0.000). A P-value of 0.000 indicates that the null hypothesis (all means are equal) is rejected at any reasonable significance level. This means there is evidence of at least one mean being different.
Step 3: Recognize the limitation of ANOVA. While ANOVA indicates that at least one mean is different, it does not identify which specific means differ. To determine this, post-hoc tests such as Tukey's HSD, Bonferroni, or Scheffé tests are required.
Step 4: Explain the next steps. To identify which specific sample means differ, conduct a post-hoc test. These tests compare each pair of means to determine if the difference is statistically significant while controlling for Type I error.
Step 5: Conclude the interpretation. Rejecting the null hypothesis in ANOVA suggests that there is a difference among the group means, but further analysis (post-hoc tests) is necessary to pinpoint the specific groups with significant differences.

This video solution was recommended by our tutors as helpful for the problem above
Video duration:
1mPlay a video:
Was this helpful?
Key Concepts
Here are the essential concepts you must grasp in order to answer the question correctly.
Analysis of Variance (ANOVA)
ANOVA is a statistical method used to compare the means of three or more groups to determine if at least one group mean is significantly different from the others. It assesses the impact of one or more factors by comparing the variance within groups to the variance between groups. A significant F-value indicates that the group means are not all equal, prompting further investigation into which specific means differ.
Recommended video:
Guided course
Variance & Standard Deviation of Discrete Random Variables
F-value
The F-value is a ratio used in ANOVA that compares the variance between the group means to the variance within the groups. A higher F-value suggests a greater disparity between the group means relative to the variability within the groups. In the provided ANOVA table, an F-value of 503.06 indicates a strong likelihood that at least one group mean is significantly different from the others.
Recommended video:
Critical Values: t-Distribution
P-value
The P-value in hypothesis testing indicates the probability of observing the data, or something more extreme, assuming the null hypothesis is true. A P-value of 0.000, as shown in the ANOVA table, suggests that the observed differences in means are statistically significant, leading to the rejection of the null hypothesis that all group means are equal. This implies that at least one sample mean is significantly different from the others.
Recommended video:
Guided course
Step 3: Get P-Value
Watch next
Master Step 1: Write Hypotheses with a bite sized video explanation from Patrick
Start learningRelated Videos
Related Practice
Textbook Question