Back
BackProblem 6
The spectrum shown here is for a molecule with a molecular formula of C₄H₉Cl. Suggest a structure for this molecule.
<IMAGE>
Problem 8
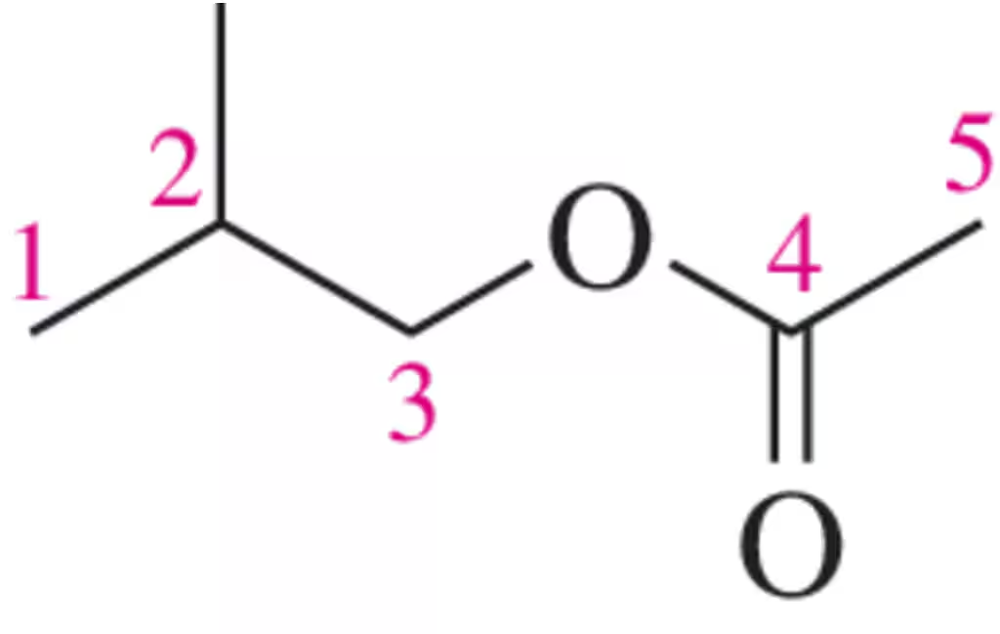
Draw the peak that would correspond to the hydrogens at C₃ in the molecule shown. Be sure to indicate the integration and place it at an appropriate chemical shift.
Problem 9
Calculate the index of hydrogen deficiency for curacin A, which has a molecular formula of C23H35NOS .
Problem 14a
How many sets of equivalent hydrogens are in each molecule shown?
(a)
Problem 14b
How many sets of equivalent hydrogens are in each molecule shown?
(b)
Problem 14c
How many sets of equivalent hydrogens are in each molecule shown?
(c)
Problem 15a
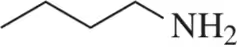
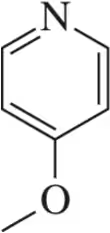
How many unique ¹H NMR signals would you expect in an NMR spectrum for the following molecules?
(a)
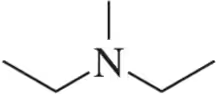
Problem 15b
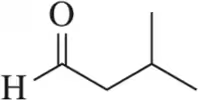
How many unique ¹H NMR signals would you expect in an NMR spectrum for the following molecules?
(b)
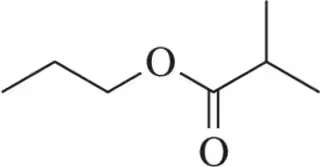
Problem 15c
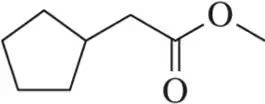
How many unique ¹H NMR signals would you expect in an NMR spectrum for the following molecules?
(c)
Problem 16
How many sets of equivalent hydrogens are present in the molecule that resulted in this NMR spectrum? [Recall that some signals can be split into multiple peaks—they are still just one signal.]
<IMAGE>
Problem 17
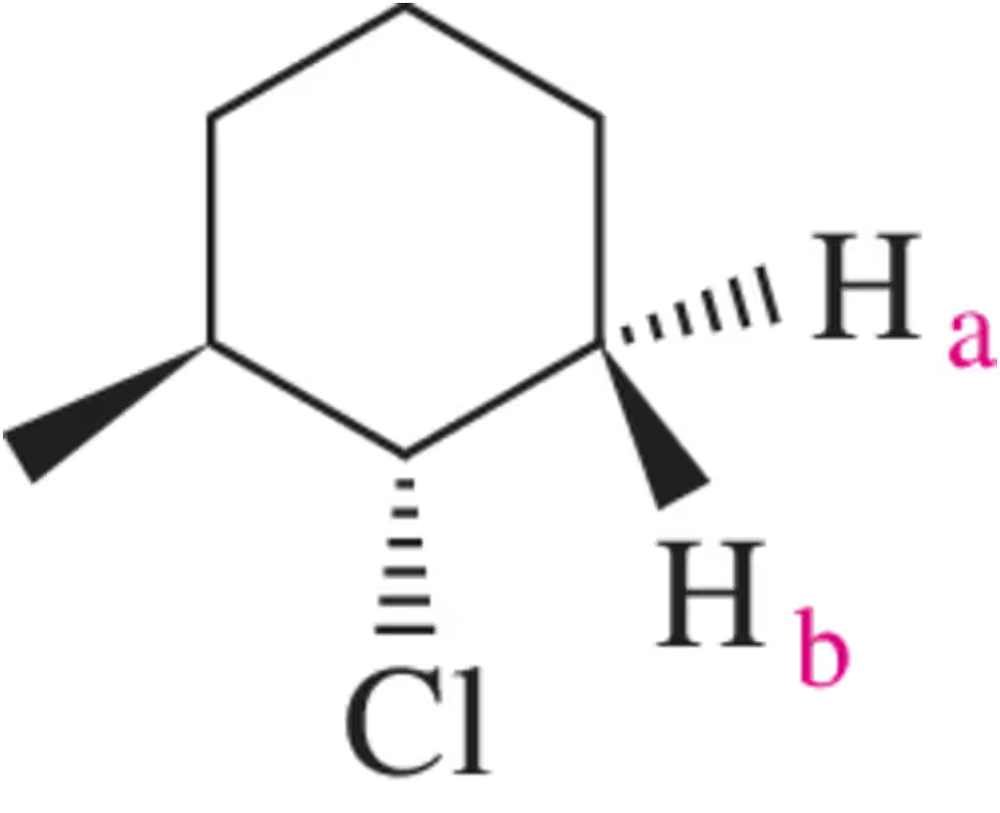
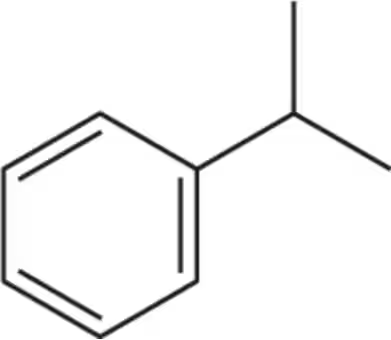
If rotation is restricted, as in the case of the molecule shown, the hydrogens labeled a and b are nonequivalent. Why?
Problem 18
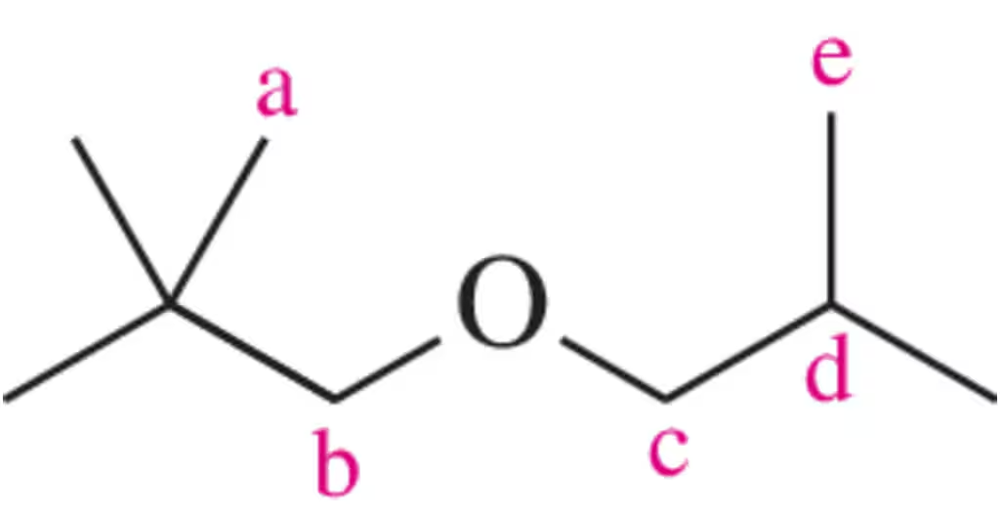
Without worrying about the relative location of the signals (i.e., the chemical shift) or the splitting patterns, draw a spectrum of the following molecule. Be sure to label each signal based on the set of equivalent hydrogens to which it corresponds.
Problem 19b
For the molecules shown, give the number of signals expected and the relative ratio of the signal integrations.
(b)
Problem 20
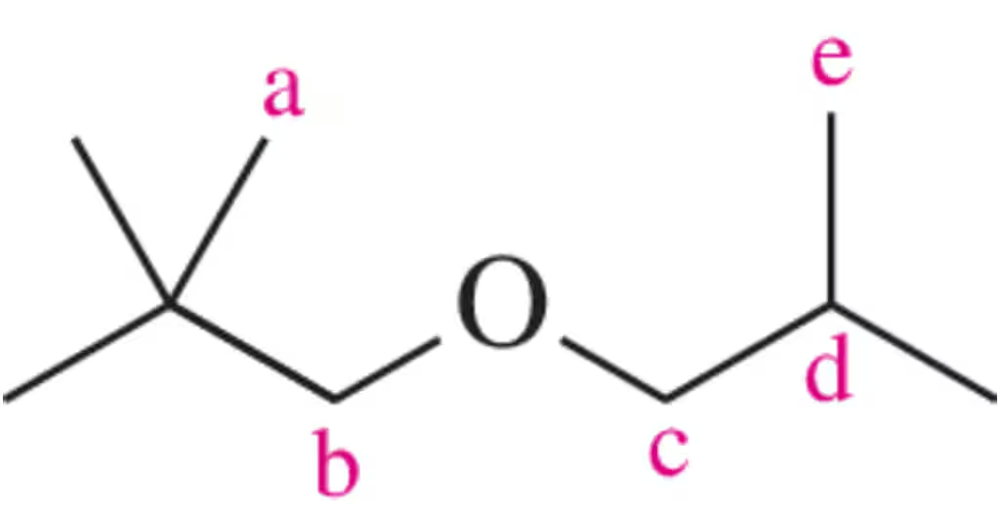
Without worrying about the relative location of the signals (i.e., the chemical shift) or the splitting patterns, draw a spectrum of the following molecule, being sure to indicate the integration of each peak. Label each signal based on the set of equivalent hydrogens to which it corresponds. [We expand on this question in future assessments.]
Problem 21
(a) Calculate the resonance frequency of an aldehydic proton ( δ 9.3 ppm) if it is detected on a 60-MHz NMR spectrometer.
(b) What if it were detected on a 300-MHz instrument?
Problem 23a
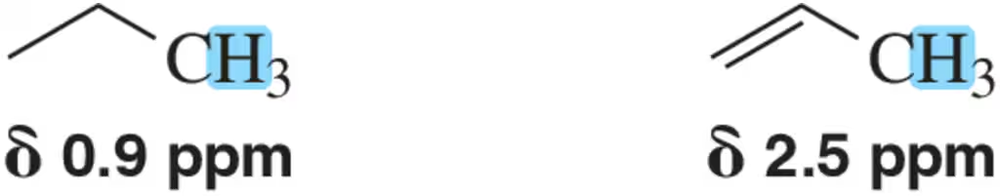
The methyl hydrogens in propane appear at a chemical shift of 0.9 ppm, whereas the methyl hydrogens of propene appear around 2.5 ppm. Explain.
Problem 27
An unknown compound (C₇H₆O) gives the IR spectrum shown here. At what chemical shifts would you expect to see signals in the ¹H NMR spectrum?
<IMAGE>
Problem 28
In Figure 15.34, Ha was assumed to be 'up.' How does the analysis change if we assume instead that Ha is down?
Problem 29
Though Figure 15.34 was concerned with the appearance of Ha, how would Hb appear in the spectrum?
Problem 30
Draw all of the possible spin states to explain why a hydrogen with four neighbors appears as a quintet (quint, five peaks).
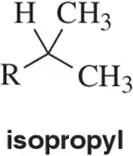
Problem 33c
Being able to recognize patterns of integration and multiplicity for common functional groups makes structure identification more efficient. Draw the pattern of integration and multiplicity you'd expect to see for each common alkyl group.
(c)
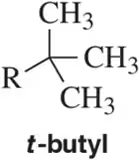
Problem 33d
Being able to recognize patterns of integration and multiplicity for common functional groups makes structure identification more efficient. Draw the pattern of integration and multiplicity you'd expect to see for each common alkyl group.
(d)
Problem 35b
Draw a spectrum for each of the following molecules, being sure to indicate the multiplicity, integration, and chemical shift of each peak. Label each signal based on the set of equivalent hydrogens to which it corresponds.
(b)
Problem 35c
Draw a spectrum for each of the following molecules, being sure to indicate the multiplicity, integration, and chemical shift of each peak. Label each signal based on the set of equivalent hydrogens to which it corresponds.
(c)
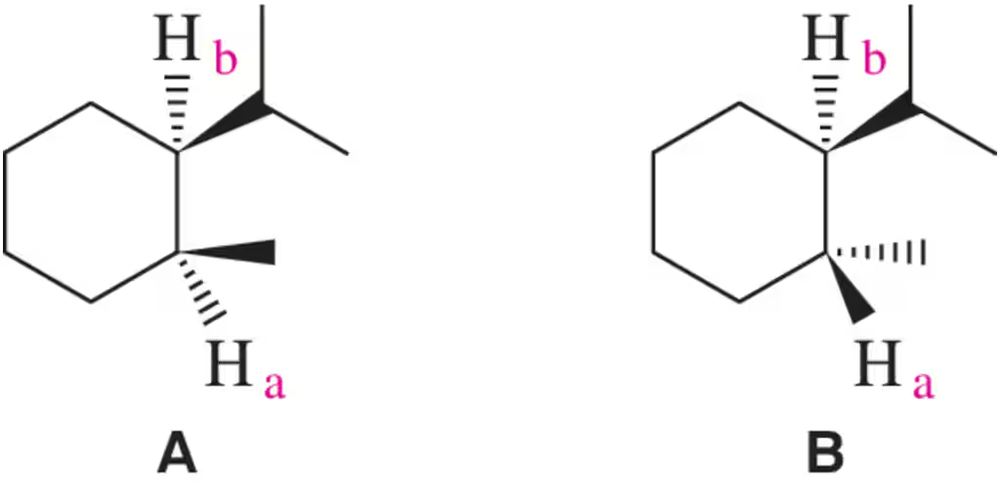
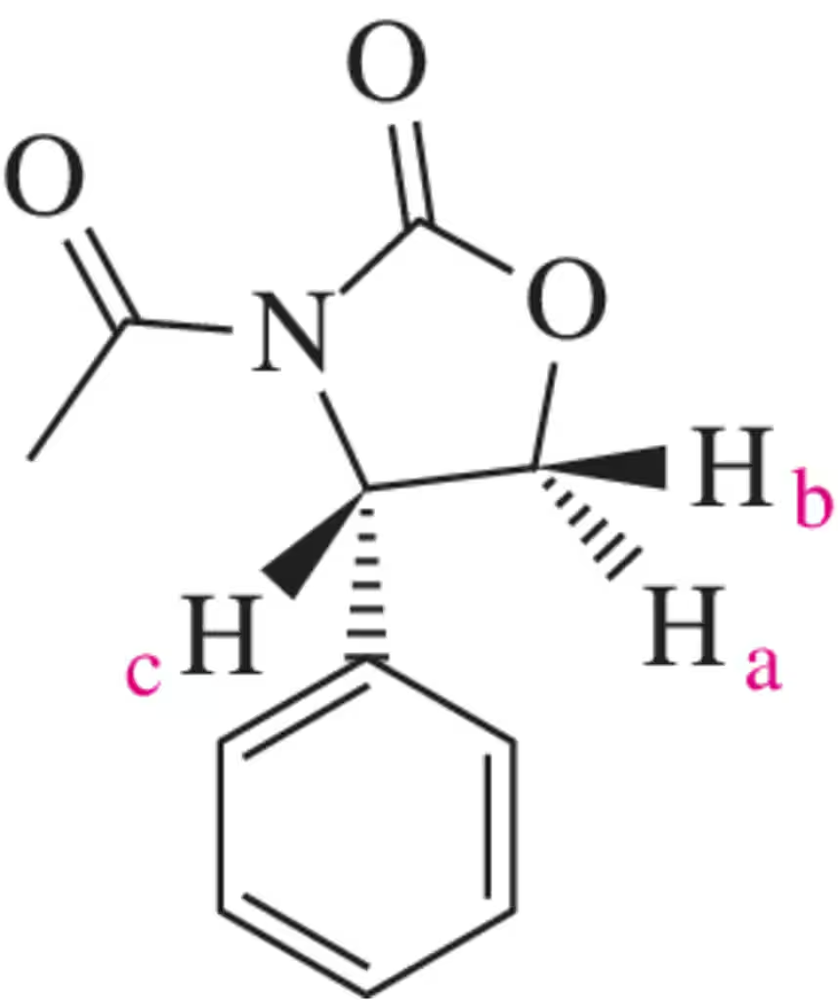
Problem 37
A chemist made what was thought to be compound A or B. How could coupling constants between Ha and Hb be used to distinguish between the two isomers? [Hint: Draw a chair conformation of each.]
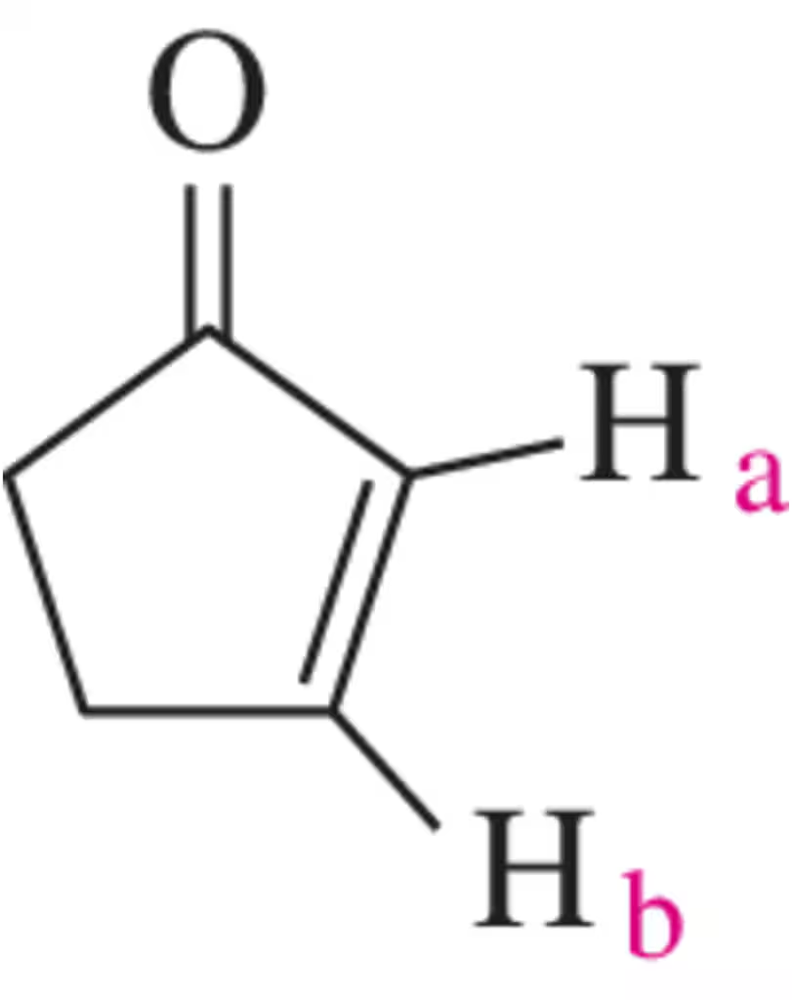
Problem 38
What coupling constant would you expect between Hₐ and H₆ in cyclopent-2-en-1-one?
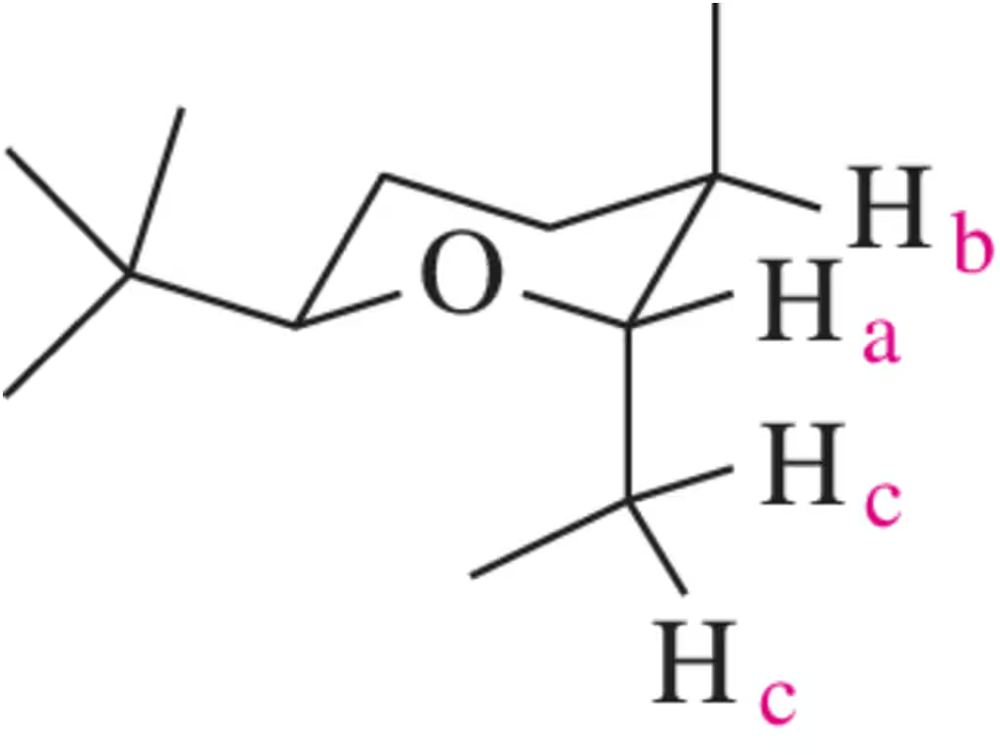
Problem 39
Alkene hydrogens usually appear at similar chemical shifts between 5 and 6 ppm. The alkene hydrogens in the structure shown are very different. Rationalize the difference in chemical shifts between Hₐ and H₆ in the structure shown.
Problem 40a
Draw the expected signal for a hydrogen with the following coupling constants.
(a) Hₐ : δ 5.34 (Jₐ꜀ = 12 , Jₐ₆ = 2)
Problem 40b
Draw the expected signal for a hydrogen with the following coupling constants.
(b) Hₐ : δ 3.34 (Jₐ꜀ = 9 , Jₐ₆ = 4 )
Problem 41
Though it wasn't discussed, what coupling constant would you expect for Hₐ and H꜀ in the spectrum of trans-but-2-enoic acid in Figure 15.50? Justify your answer.
<IMAGE>