Back
BackProblem 60b
Predict the splitting pattern for each of the indicated hydrogens in Assessment 15.59.
(b)
Problem 60c
Predict the splitting pattern for each of the indicated hydrogens in Assessment 15.59.
(c)
Problem 60d
Predict the splitting pattern for each of the indicated hydrogens in Assessment 15.59.
(d)
Problem 60e
Predict the splitting pattern for each of the indicated hydrogens in Assessment 15.59.
(e)
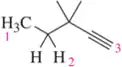
Problem 60f
Predict the splitting pattern for each of the indicated hydrogens in Assessment 15.59.
(f)
Problem 61a
Draw the signal for the following multiplicities. What is the ratio of peaks within each signal?
(a) doublet
Problem 61b
Draw the signal for the following multiplicities. What is the ratio of peaks within each signal?
(b) triplet
Problem 61c
Draw the signal for the following multiplicities. What is the ratio of peaks within each signal?
(c) quartet
Problem 61d
Draw the signal for the following multiplicities. What is the ratio of peaks within each signal?
(d) quintet
Problem 61e
Draw the signal for the following multiplicities. What is the ratio of peaks within each signal?
(e) sextet
Problem 61f
Draw the signal for the following multiplicities. What is the ratio of peaks within each signal?
(f) septet
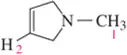
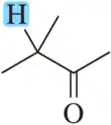
Problem 62c
For the hydrogen(s) screened in blue, draw the signal you would expect to see in a ¹H NMR spectrum. At which chemical shift would the signal appear?
(c)
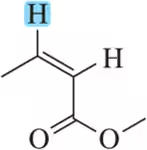
Problem 62e
For the hydrogen(s) screened in blue, draw the signal you would expect to see in a ¹H NMR spectrum. At which chemical shift would the signal appear?
(e)
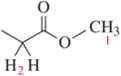
Problem 63b
Complete the table of ¹H NMR data you'd generate for each of the following molecules.
(b)
Problem 63c
Complete the table of ¹H NMR data you'd generate for each of the following molecules.
(c)
Problem 63d
Complete the table of ¹H NMR data you'd generate for each of the following molecules.
(d)
Problem 64b
Draw the ¹H NMR spectrum you would expect to see for each of the molecules in Assessment 15.63.
(b)
Problem 64c
Draw the ¹H NMR spectrum you would expect to see for each of the molecules in Assessment 15.63.
(c)
Problem 64d
Draw the ¹H NMR spectrum you would expect to see for each of the molecules in Assessment 15.63.
(d)
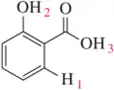
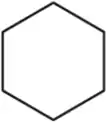
Problem 66a
For the molecules in Assessment 15.58, give an approximate chemical shift for each indicated carbon. [The range of correct answers is large here.].
(a)
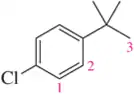
Problem 66c
For the molecules in Assessment 15.58, give an approximate chemical shift for each indicated carbon. [The range of correct answers is large here.].
(c)
Problem 67a
Draw the ¹³C NMR spectrum you would expect to see for each of the molecules shown.
(a)
Problem 67b
Draw the 13C NMR spectrum you would expect to see for each of the molecules shown.
(b)
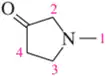
Problem 67c
Draw the 13C NMR spectrum you would expect to see for each of the molecules shown.
(c)
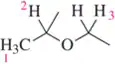
Problem 69
Assign the peaks in the ¹H NMR spectrum for the molecule shown.
<IMAGE>
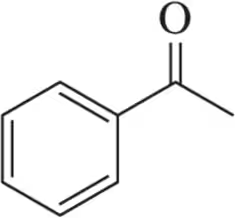
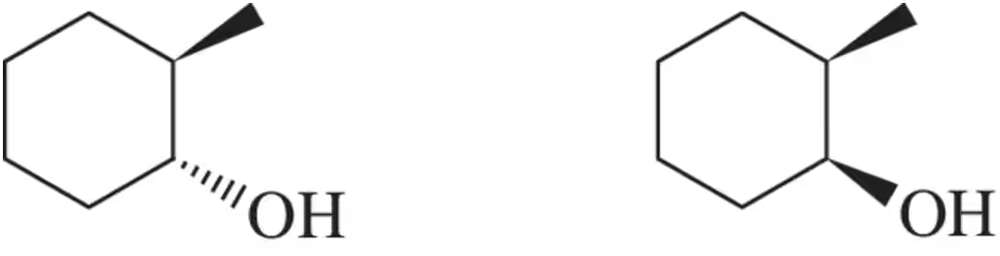
Problem 74
A graduate student ran a reaction that produced a mixture of the following two compounds. After painstaking purification, she is able to separate the two compounds. Using ¹H NMR, how can she determine which diastereomer is in which separated sample?
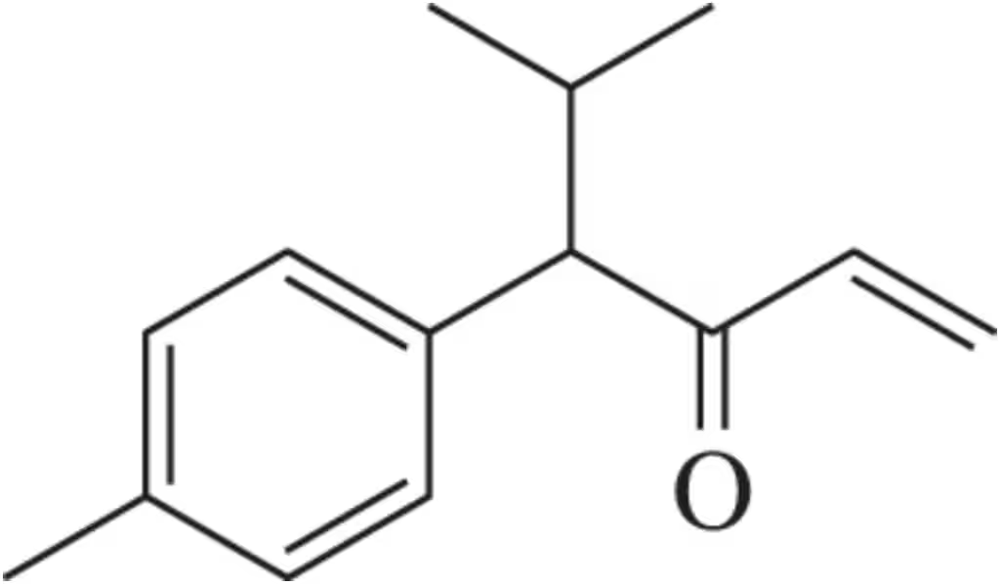
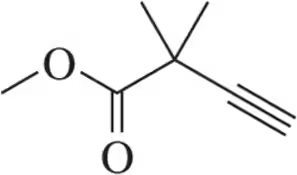
Problem 76
For the compound shown, produce a table of the shift, integration, and multiplicity of each peak you would expect to see in a ¹H NMR spectrum.
Problem 77
In the lab, ¹H NMR is often used to verify that a reaction has worked as expected by comparing the product spectrum with what is expected. Given the ¹H NMR of the reactant shown, draw the spectrum you'd expect to see of the product that results.
<IMAGE>
Problem 78a
Given the ¹H NMR spectrum and the molecular formula, suggest a structure for each molecule. [The IR spectrum suggests the presence of two C=O bonds.]
(a) Important IR bands (cm ⁻ ¹) : 1728, 1708 [Note: The pKₐ of this molecule is around 10.]
<IMAGE>
Problem 78b
Given the ¹H NMR spectrum and the molecular formula, suggest a structure for each molecule. [The IR spectrum suggests the presence of two C=O bonds.]
(b) <IMAGE>


![Chemical structure of a bicyclo[3.1.0]hexane molecule, featuring a six-membered ring with a three-carbon bridge.](https://static.studychannel-dev.pearsondev.tech/courses/organic-chemistry/thumbnails/805e7cc2-f5ca-4655-bcd0-861439e09935)