Back
BackProblem 7.4.17a
Brain Volumes Use these measures of brain volumes from Data Set 12 “IQ and Brain Size” in Appendix B. Use the bootstrap method with 1000 bootstrap samples.
a. Use 1000 bootstrap samples to construct a 90% confidence interval estimate of the population mean.
Problem 7.1.21a
Critical Thinking. In Exercises 17–28, use the data and confidence level to construct a confidence interval estimate of p, then address the given question.
Touch Therapy When she was 9 years of age, Emily Rosa did a science fair experiment in which she tested professional touch therapists to see if they could sense her energy field. She flipped a coin to select either her right hand or her left hand, and then she asked the therapists to identify the selected hand by placing their hand just under Emily’s hand without seeing it and without touching it. Among 280 trials, the touch therapists were correct 123 times (based on data in “A Close Look at Therapeutic Touch,” Journal of the American Medical Association, Vol. 279, No. 13).
a. Given that Emily used a coin toss to select either her right hand or her left hand, what proportion of correct responses would be expected if the touch therapists made random guesses?
Problem 7.4.23a
Analysis of Last Digits Weights of respondents were recorded as part of the California Health Interview Survey. The last digits of weights from 50 randomly selected respondents are listed below.
a. Use the bootstrap method with 1000 bootstrap samples to find a 95% confidence interval estimate of .
Problem 7.3.16a
Comparing Waiting Lines
The values listed below are waiting times (in minutes) of customers at the Jefferson Valley Bank, where customers enter a single waiting line that feeds three teller windows. Construct a 95% confidence interval for the population standard deviation sigma.
Problem 7.4.11a
Archeology Archeologists have studied sizes of Egyptian skulls in an attempt to determine whether breeding occurred between different cultures. Listed below are the widths (mm) of skulls from 150 A.D. (based on data from Ancient Races of the Thebaid by Thomson and Randall-Maciver).
a. Use 1000 bootstrap samples to construct a 99% confidence interval estimate of the mean skull width.
Problem 7.1.34a
Astrology A sociologist plans to conduct a survey to estimate the percentage of adults who believe in astrology. How many people must be surveyed if we want a confidence level of 99% and a margin of error of four percentage points?
a. Assume that nothing is known about the percentage to be estimated.
Problem 7.1.33a
E-Cigarettes A New York Times article reported that a survey conducted in 2014 included 36,000 adults, with 3.7% of them being regular users of e-cigarettes. Because e-cigarette use is relatively new, there is a need to obtain today’s usage rate. How many adults must be surveyed now if we want a confidence level of 95% and a margin of error of 1.5 percentage points?
a. Assume that nothing is known about the rate of e-cigarette usage among adults.
Problem 7.2.25a
Mean Pulse Rate of Males Data Set 1 “Body Data” in Appendix B includes pulse rates of 153 randomly selected adult males, and those pulse rates vary from a low of 40 bpm to a high of 104 bpm. Find the minimum sample size required to estimate the mean pulse rate of adult males. Assume that we want 99% confidence that the sample mean is within 2 bpm of the population mean.
a. Find the sample size using the range rule of thumb to estimate .
Problem 7.4.8a
Cell Phone Radiation Here is a sample of measured radiation emissions (cW/kg) for cell phones (based on data from the Environmental Working Group): 38, 55, 86, 145. Here are ten bootstrap samples:
[Image]
a. Using only the ten given bootstrap samples, construct an 80% confidence interval estimate of the population mean.
Problem 7.1.37a
Smart Phone Apple is planning for the launch of a new and improved iPhone. The marketing team wants to know the worldwide percentage of consumers who intend to purchase the new model, so a survey is being planned. How many people must be surveyed in order to be 90% confident that the estimated percentage is within three percentage points of the true population percentage?
a. Assume that nothing is known about the worldwide percentage of consumers who intend to buy the new model.
Problem 7.1.19a
Critical Thinking. In Exercises 17–28, use the data and confidence level to construct a confidence interval estimate of p, then address the given question.
Tennis Challenges In a recent U. S. Open tennis tournament, women playing singles matches used challenges on 137 calls made by the line judges. Among those challenges, 33 were found to be successful with the call overturned.
a. Construct a 99% confidence interval for the percentage of successful challenges.
Problem 7.4.7a
Freshman 15 Here is a sample of amounts of weight change (kg) of college students in their freshman year (from Data Set 13 “Freshman 15” in Appendix B): 11, 3, 0, , where represents a loss of 2 kg and positive values represent weight gained. Here are ten bootstrap samples:
[Image]
a. Using only the ten given bootstrap samples, construct an 80% confidence interval estimate of the mean weight change for the population.
Problem 7.3.22a
Large Data Sets from Appendix B. In Exercises 21 and 22, use the data set in Appendix B. Assume that each sample is a simple random sample obtained from a population with a normal distribution.
Birth Weights Refer to Data Set 6 “Births” in Appendix B.
a. Use the 205 birth weights of girls to construct a 95% confidence interval estimate of the standard deviation of the population from which the sample was obtained.
Problem 7.1.24a
Critical Thinking. In Exercises 17–28, use the data and confidence level to construct a confidence interval estimate of p, then address the given question.
Job Interviews In a Harris poll of 514 human resource professionals, 90% said that the appearance of a job applicant is most important for a good first impression.
a. Among the 514 human resource professionals who were surveyed, how many of them said that the appearance of a job applicant is most important for a good first impression?
Problem 7.1.41a
No Failures According to the Rule of Three, when we have a sample size n with x=0 successes, we have 95% confidence that the true population proportion has an upper bound of 3/n. (See “A Look at the Rule of Three,” by Jovanovic and Levy, American Statistician, Vol. 51, No. 2.)
a. If n independent trials result in no successes, why can’t we find confidence interval limits by using the methods described in this section?
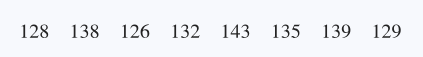
Problem 7.4.15a
15. HEIGHTS OF FEMALE SOCCER PLAYERS Listed below are the heights (in.) of players on the U.S. Women’s National Soccer Team (at the time of this writing). Use those heights as a sample of the heights of all professional women soccer players.
a. Use 1000 bootstrap samples to construct a 95% confidence interval estimate of σ.
Problem 7.1.36b
Online Gambling Some states now allow online gambling. As a marketing manager for a casino, you need to determine the percentage of adults in those states who gamble online. How many adults must you survey in order to be 99% confident that your estimate is in error by no more than two percentage points?
b. Assume that 18% of all adults gamble online (based on 2017 data from a Gambling Commission study in Great Britain).
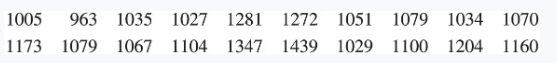
Problem 7.4.16b
Mint Specs Listed below are weights (grams) from a simple random sample of pennies produced after 1983 (from Data Set 40 “Coin Weights” in Appendix B).
b. How does the result compare to the confidence interval found in Exercise 14 in Section 7-3?
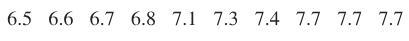
Problem 7.4.12b
Minting Quarters Listed below are weights (grams) of quarters minted after 1964 (based on Data Set 40 “Coin Weights” in Appendix B).
b. Specifications require that the quarters have a weight of 5.670 g. What does the confidence interval suggest about that specification?
Problem 7.4.7b
7. FRESHMAN 15 Here is a sample of amounts of weight change (kg) of college students in their freshman year (from Data Set 13 “Freshman 15” in Appendix B): 11, 3, 0, –2, where –2 represents a loss of 2 kg and positive values represent weight gained. Here are ten bootstrap samples:
{11, 11, 11, 0}, {11, –2, 0, 11}, {11, –2, 3, 0}, {3, –2, 0, 11}, {0, 0, 0, 3}, {3, –2, 3, –2}, {11, 3, –2, 0}, {–2, 3, –2, 3}, {–2, 0, –2, 3}, {3, 11, 11, 11}.
b. Using only the ten given bootstrap samples, construct an 80% confidence interval estimate of the standard deviation of the weight changes for the population.
Problem 7.1.34b
Astrology A sociologist plans to conduct a survey to estimate the percentage of adults who believe in astrology. How many people must be surveyed if we want a confidence level of 99% and a margin of error of four percentage points?
b. Use the information from a previous Harris survey in which 26% of respondents said that they believed in astrology.
Problem 7.1.19b
Critical Thinking. In Exercises 17–28, use the data and confidence level to construct a confidence interval estimate of p, then address the given question.
Tennis Challenges In a recent U. S. Open tennis tournament, women playing singles matches used challenges on 137 calls made by the line judges. Among those challenges, 33 were found to be successful with the call overturned.
b. Compare the result from part (a) to this 99% confidence interval for the percentage of successful challenges made by the men playing singles matches: . Does it appear that either gender is more successful than the other?
Problem 7.1.32b
Touch Your Nose With Your Tongue Find the sample size needed to estimate the percentage of adults who can touch their nose with their tongue. Use a margin of error of 2 percentage points and use a confidence level of 90%.
b. Assume that a previous study showed that 10% of adults can touch their nose with their tongue (based on data from Onedio).
Problem 7.2.34b
Finite Population Correction Factor If a simple random sample of size n is selected without replacement from a finite population of size (n>0.05N), and the sample size is more than 5% of the population size , better results can be obtained by using the finite population correction factor, which involves multiplying the margin of error E by [Image]. Refer to the weights of the M&M candies in Data Set 38 “Candies” in Appendix B.
b. Use only the red M&Ms and treat that sample as a simple random sample selected from the population of the 345 M&Ms listed in the data set. Find the 95% confidence interval estimate of the mean weight of all 345 M&Ms. Compare the result to the actual mean of the population of all 345 M&Ms.
Problem 7.3b
Voting Survey In a survey of 1002 people, 70% said that they voted in a recent presidential election (based on data from ICR Research Group). Voting records show that 61% of eligible voters actually did vote.
b. Find a 95% confidence interval estimate of the percentage of people who say that they voted.
Problem 7.1.33b
E-Cigarettes A New York Times article reported that a survey conducted in 2014 included 36,000 adults, with 3.7% of them being regular users of e-cigarettes. Because e-cigarette use is relatively new, there is a need to obtain today’s usage rate. How many adults must be surveyed now if we want a confidence level of 95% and a margin of error of 1.5 percentage points?
b. Use the results from the 2014 survey.
Problem 7.1.31b
Wiggle Your Ears Find the sample size needed to estimate the percentage of adults who can wiggle their ears. Use a margin of error of 3 percentage points and use a confidence level of 99%.
b. Assume that 22% of adults can wiggle their ears (based on data from Soul Publishing).
Problem 7.3.16b
Comparing Waiting Lines
The values listed below are waiting times (in minutes) of customers at the Bank of Providence, where customers may enter any one of three different lines that have formed at three teller windows. Construct a 95% confidence interval for the population standard deviation sigma.
Problem 7.1.37b
Smart Phone Apple is planning for the launch of a new and improved iPhone. The marketing team wants to know the worldwide percentage of consumers who intend to purchase the new model, so a survey is being planned. How many people must be surveyed in order to be 90% confident that the estimated percentage is within three percentage points of the true population percentage?
b. Assume that 11% of consumers have a smartphone and plan to upgrade to a new model.
Problem 7.1.20b
Critical Thinking. In Exercises 17–28, use the data and confidence level to construct a confidence interval estimate of p, then address the given question.
OxyContin The drug OxyContin (oxycodone) is used to treat pain, but it is dangerous because it is addictive and can be lethal. In clinical trials, 227 subjects were treated with OxyContin and 52 of them developed nausea (based on data from Purdue Pharma L.P.).
b. Compare the result from part (a) to this 95% confidence interval for 5 subjects who developed nausea among the 45 subjects given a placebo instead of OxyContin: . What do you conclude?