Back
BackProblem 7.1.20b
Critical Thinking. In Exercises 17–28, use the data and confidence level to construct a confidence interval estimate of p, then address the given question.
OxyContin The drug OxyContin (oxycodone) is used to treat pain, but it is dangerous because it is addictive and can be lethal. In clinical trials, 227 subjects were treated with OxyContin and 52 of them developed nausea (based on data from Purdue Pharma L.P.).
b. Compare the result from part (a) to this 95% confidence interval for 5 subjects who developed nausea among the 45 subjects given a placebo instead of OxyContin: . What do you conclude?
Problem 7.9b
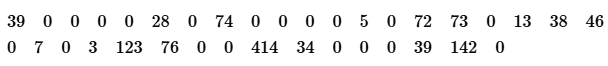
Alcohol in Children’s Movies Listed below is a simple random sample of times (seconds) that animated children’s movies showed the use of alcohol (based on Data Set 20 “Alcohol and Tobacco in Movies” in Appendix B).
b. Are the requirements for constructing a 95% confidence interval estimate of the population standard deviation satisfied? If so, construct that confidence interval.
Problem 7.2.25b
Mean Pulse Rate of Males Data Set 1 “Body Data” in Appendix B includes pulse rates of 153 randomly selected adult males, and those pulse rates vary from a low of 40 bpm to a high of 104 bpm. Find the minimum sample size required to estimate the mean pulse rate of adult males. Assume that we want 99% confidence that the sample mean is within 2 bpm of the population mean.
b. Assume that sigma=11.3 bpm, based on the value of s=11.3 bpm for the sample of 153 male pulse rates.
Problem 7.1.34b
Astrology A sociologist plans to conduct a survey to estimate the percentage of adults who believe in astrology. How many people must be surveyed if we want a confidence level of 99% and a margin of error of four percentage points?
b. Use the information from a previous Harris survey in which 26% of respondents said that they believed in astrology.
Problem 7.1.19b
Critical Thinking. In Exercises 17–28, use the data and confidence level to construct a confidence interval estimate of p, then address the given question.
Tennis Challenges In a recent U. S. Open tennis tournament, women playing singles matches used challenges on 137 calls made by the line judges. Among those challenges, 33 were found to be successful with the call overturned.
b. Compare the result from part (a) to this 99% confidence interval for the percentage of successful challenges made by the men playing singles matches: . Does it appear that either gender is more successful than the other?
Problem 7.1.32b
Touch Your Nose With Your Tongue Find the sample size needed to estimate the percentage of adults who can touch their nose with their tongue. Use a margin of error of 2 percentage points and use a confidence level of 90%.
b. Assume that a previous study showed that 10% of adults can touch their nose with their tongue (based on data from Onedio).
Problem 7.1.23c
Critical Thinking. In Exercises 17–28, use the data and confidence level to construct a confidence interval estimate of p, then address the given question.
Job Interviews In a Harris poll of 514 human resource professionals, 45.9% said that body piercings and tattoos were big personal grooming red flags.
c. Repeat part (b) using a confidence level of 80%.
Problem 7.1.38c
Women Who Give Birth An epidemiologist plans to conduct a survey to estimate the percentage of women who give birth. How many women must be surveyed in order to be 99% confident that the estimated percentage is in error by no more than two percentage points?
c. What is wrong with surveying randomly selected adult women?
Problem 7.1.21c
Critical Thinking. In Exercises 17–28, use the data and confidence level to construct a confidence interval estimate of p, then address the given question.
Touch Therapy When she was 9 years of age, Emily Rosa did a science fair experiment in which she tested professional touch therapists to see if they could sense her energy field. She flipped a coin to select either her right hand or her left hand, and then she asked the therapists to identify the selected hand by placing their hand just under Emily’s hand without seeing it and without touching it. Among 280 trials, the touch therapists were correct 123 times (based on data in “A Close Look at Therapeutic Touch,” Journal of the American Medical Association, Vol. 279, No. 13).
c. Using Emily’s sample results, construct a 99% confidence interval estimate of the proportion of correct responses made by touch therapists.
Problem 7.c.10a
Tour de France Listed below are the average speeds (km/h) of winners of the Tour de France men’s bicycle race. The speeds are listed in order by year, beginning with the year 2000.
a. Construct a 95% confidence interval estimate of the population mean.
Problem 7.1.37c
Smart Phone Apple is planning for the launch of a new and improved iPhone. The marketing team wants to know the worldwide percentage of consumers who intend to purchase the new model, so a survey is being planned. How many people must be surveyed in order to be 90% confident that the estimated percentage is within three percentage points of the true population percentage?
c. Given that the required sample size is relatively small, could you simply survey the people that you know?
Problem 7.1.33c
E-Cigarettes A New York Times article reported that a survey conducted in 2014 included 36,000 adults, with 3.7% of them being regular users of e-cigarettes. Because e-cigarette use is relatively new, there is a need to obtain today’s usage rate. How many adults must be surveyed now if we want a confidence level of 95% and a margin of error of 1.5 percentage points?
c. Does the use of the result from the 2014 survey have much of an effect on the sample size?
Problem 7.3d
Voting Survey In a survey of 1002 people, 70% said that they voted in a recent presidential election (based on data from ICR Research Group). Voting records show that 61% of eligible voters actually did vote.
d. Are the survey results consistent with the actual voter turnout of 61%? Why or why not?
Problem 7.r.9a
Alcohol in Children’s Movies Listed below is a simple random sample of times (seconds) that animated children’s movies showed the use of alcohol (based on Data Set 20 “Alcohol and Tobacco in Movies” in Appendix B).
a. Are the requirements for constructing a 95% confidence interval estimate of the population mean satisfied? If so, construct that confidence interval.
Problem 7.r.1b
Bachelor’s Degree in Four Years In a study of government financial aid for college students, it becomes necessary to estimate the percentage of full-time college students who earn a bachelor’s degree in four years or less. Find the sample size needed to estimate that percentage. Use a 0.1 margin of error, and use a confidence level of 95%.
b. Assume that prior studies have shown that about 40% of full-time students earn bachelor’s degrees in four years or less.
Problem 7.r.1a
Bachelor’s Degree in Four Years In a study of government financial aid for college students, it becomes necessary to estimate the percentage of full-time college students who earn a bachelor’s degree in four years or less. Find the sample size needed to estimate that percentage. Use a 0.1 margin of error, and use a confidence level of 95%.
a. Assume that nothing is known about the percentage to be estimated.
Problem 7.r.2
Bachelor’s Degree The president of Brown University wants to estimate the mean time (years) it takes students to earn a bachelor’s degree. How many students must be surveyed in order to be 95% confident that the estimate is within 0.2 year of the true population mean? Assume that the population standard deviation is sigma=1.3 years