Back
BackProblem 8.3.5
Finding P-values
In Exercises 5–8, either use technology to find the P-value or use Table A-3 to find a range of values for the P-value. Based on the result, what is the final conclusion?
Weights of Quarters The claim is that weights (grams) of quarters made after 1964 have a mean equal to 5.670 g as required by mint specifications. The sample size is and the test statistic is t = -3.135.
Problem 8.4.14
Testing Claims About Variation
In Exercises 5–16, test the given claim. Identify the null hypothesis, alternative hypothesis, test statistic, P-value, or critical value(s), then state the conclusion about the null hypothesis, as well as the final conclusion that addresses the original claim. Assume that a simple random sample is selected from a normally distributed population.
Bank Lines The Jefferson Valley Bank once had a separate customer waiting line at each teller window, but it now has a single waiting line that feeds the teller windows as vacancies occur. The standard deviation of customer waiting times with the old multiple-line configuration was 1.8 min. Listed below is a simple random sample of waiting times (minutes) with the single waiting line. Use a 0.05 significance level to test the claim that with a single waiting line, the waiting times have a standard deviation less than 1.8 min. What improvement occurred when banks changed from multiple waiting lines to a single waiting line?
6.5 6.6 6.7 6.8 7.1 7.3 7.4 7.7 7.7 7.7
Problem 8.4.10
Testing Claims About Variation
In Exercises 5–16, test the given claim. Identify the null hypothesis, alternative hypothesis, test statistic, P-value, or critical value(s), then state the conclusion about the null hypothesis, as well as the final conclusion that addresses the original claim. Assume that a simple random sample is selected from a normally distributed population.
Minting of Pennies Data Set 40 “Coin Weights” lists weights (grams) of pennies minted after 1983. Here are the statistics for those weights: n = 37, xbar = 2.49910 g, s = 0.01648 g . Use a 0.05 significance level to test the claim that the sample is from a population of pennies with weights having a standard deviation greater than 0.01000 g.
Problem 8.1.3
Interpreting P-value The Ericsson method is one of several methods claimed to increase the likelihood of a baby girl. In a clinical trial, results could be analyzed with a formal hypothesis test with the alternative hypothesis of p > 0.5 which corresponds to the claim that the method increases the likelihood of having a girl, so that the proportion of girls is greater than 0.5. If you have an interest in establishing the success of the method, which of the following P-values would you prefer as a result in your hypothesis test: 0.999, 0.5, 0.95, 0.05, 0.01, 0.001? Why?
Problem 8.4.3
Minting Dollar Coins For the sample data from Exercise 1, we get a P-value of 0.0041 when testing the claim that σ < 0.04000 g.
What should we conclude about the null hypothesis?
What should we conclude about the original claim?
What do these results suggest about the new minting process?
Problem 8.1.22
Final Conclusions
In Exercises 21–24, use a significance level of α = 0.05 and use the given information for the following:
State a conclusion about the null hypothesis. (Reject H0 or fail to reject H0.)
Without using technical terms or symbols, state a final conclusion that addresses the original claim
Original claim: More than 35% of air travelers would choose another airline to have access to inflight Wi-Fi. The hypothesis test results in a P-value of 0.00001.
Problem 8.4.8
Testing Claims About Variation
In Exercises 5–16, test the given claim. Identify the null hypothesis, alternative hypothesis, test statistic, P-value, or critical value(s), then state the conclusion about the null hypothesis, as well as the final conclusion that addresses the original claim. Assume that a simple random sample is selected from a normally distributed population.
Birth Weights A simple random sample of birth weights of 30 girls has a standard deviation of 829.5 g. Use a 0.01 significance level to test the claim that birth weights of girls have the same standard deviation as birth weights of boys, which is 660.2 g (based on Data Set 6 “Births” in Appendix B).
Problem 8.3.7
Finding P-values
In Exercises 5–8, either use technology to find the P-value or use Table A-3 to find a range of values for the P-value. Based on the result, what is the final conclusion?
Cotinine in Smokers The claim is that smokers have a mean cotinine level greater than the level of 2.84 ng/mL found for nonsmokers. (Cotinine is used as a biomarker for exposure to nicotine.) The sample size is n = 902 and the test statistic is t = 56.319.
Problem 8.4.5
Testing Claims About Variation
In Exercises 5–16, test the given claim. Identify the null hypothesis, alternative hypothesis, test statistic, P-value, or critical value(s), then state the conclusion about the null hypothesis, as well as the final conclusion that addresses the original claim. Assume that a simple random sample is selected from a normally distributed population.
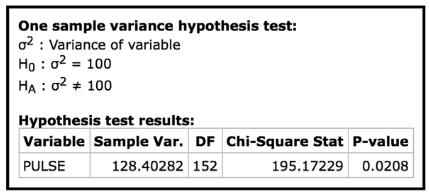
Pulse Rates of Men A simple random sample of 153 men results in a standard deviation of 11.3 beats per minute (based on Data Set 1 “Body Data” in Appendix B). The normal range of pulse rates of adults is typically given as 60 to 100 beats per minute. If the range rule of thumb is applied to that normal range, the result is a standard deviation of 10 beats per minute. Use the sample results with a 0.05 significance level to test the claim that pulse rates of men have a standard deviation equal to 10 beats per minute; see the accompanying StatCrunch display for this test. What do the results indicate about the effectiveness of using the range rule of thumb with the “normal range” from 60 to 100 beats per minute for estimating in this case?
Problem 8.1.25
Type I and Type II Errors
In Exercises 25–28, provide statements that identify the type I error and the type II error that correspond to the given claim. (Although conclusions are usually expressed in verbal form, the answers here can be expressed with statements that include symbolic expressions such as p = 0.1.)
The proportion of people who write with their left hand is equal to 0.1.
Problem 8.1.29
Interpreting Power Chantix (varenicline) tablets are used as an aid to help people stop smoking. In a clinical trial, 129 subjects were treated with Chantix twice a day for 12 weeks, and 16 subjects experienced abdominal pain (based on data from Pfizer, Inc.). If someone claims that more than 8% of Chantix users experience abdominal pain, that claim is supported with a hypothesis test conducted with a 0.05 significance level. Using 0.18 as an alternative value of p, the power of the test is 0.96. Interpret this value of the power of the test.
Problem 8.2.22
Testing Claims About Proportions
In Exercises 9–32, test the given claim. Identify the null hypothesis, alternative hypothesis, test statistic, P-value, or critical value(s), then state the conclusion about the null hypothesis, as well as the final conclusion that addresses the original claim. Use the P-value method unless your instructor specifies otherwise. Use the normal distribution as an approximation to the binomial distribution, as described in Part 1 of this section.
Online Friends A Pew Research Center poll of 1060 teens aged 13 to 17 showed that 57% of them have made new friends online. Use a 0.01 significance level to test the claim that half of all teens have made new friends online.
Problem 8.2.33
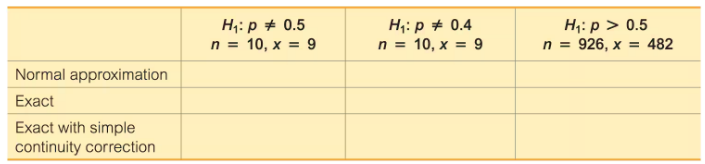
Exact Method For each of the three different methods of hypothesis testing (identified in the left column), enter the P-values corresponding to the given alternative hypothesis and sample data. Use a 0.05 significance level. Note that the entries in the last column correspond to the Chapter Problem. How do the results agree with the large sample size?
Problem 8.2.3
Statistical Literacy and Critical Thinking
In Exercises 1–4, use the results from a Hankook Tire Gauge Index survey of a simple random sample of 1020 adults. Among the 1020 respondents, 86% rated themselves as above average drivers. We want to test the claim that more than 3/4 of adults rate themselves as above average drivers.
Requirements Are the requirements of the hypothesis test all satisfied? Explain.
Problem 8.1.9
Test Statistics
In Exercises 9–12, refer to the exercise identified and find the value of the test statistic. (Refer to Table 8-2 to select the correct expression for evaluating the test statistic.)
Exercise 5 “Landline Phones”
Problem 8.2.5
Using Technology
In Exercises 5–8, identify the indicated values or interpret the given display. Use the normal distribution as an approximation to the binomial distribution, as described in Part 1 of this section. Use a 0.05 significance level and answer the following:
a. Is the test two-tailed, left-tailed, or right-tailed?
b. What is the test statistic?
c. What is the P-value?
d. What is the null hypothesis, and what do you conclude about it?
e. What is the final conclusion?
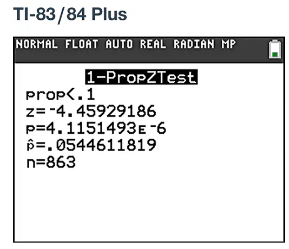
Adverse Reactions to Drug The drug Lipitor (atorvastatin) is used to treat high cholesterol. In a clinical trial of Lipitor, 47 of 863 treated subjects experienced headaches (based on data from Pfizer). The accompanying TI-83/84 Plus calculator display shows results from a test of the claim that fewer than 10% of treated subjects experience headaches.
Problem 8.1.5
Identifying H0 and H1
In Exercises 5–8, do the following:
a. Express the original claim in symbolic form.
b. Identify the null and alternative hypotheses.
Landline Phones Claim: Fewer than 10% of homes have only a landline telephone and no wireless phone. Sample data: A survey by the National Center for Health Statistics showed that among 16,113 homes, 5.8% had landline phones without wireless phones.
Problem 8.2.17
Testing Claims About Proportions
In Exercises 9–32, test the given claim. Identify the null hypothesis, alternative hypothesis, test statistic, P-value, or critical value(s), then state the conclusion about the null hypothesis, as well as the final conclusion that addresses the original claim. Use the P-value method unless your instructor specifies otherwise. Use the normal distribution as an approximation to the binomial distribution, as described in Part 1 of this section.
Births A random sample of 860 births in New York State included 426 boys. Use a 0.05 significance level to test the claim that 51.2% of newborn babies are boys. Do the results support the belief that 51.2% of newborn babies are boys?
Problem 8.5.11
Randomization: Testing a Claim About a Mean
In Exercises 9–12, use the randomization procedure for the indicated exercise.
Section 8-3, Exercise 23 “Cell Phone Radiation”
Problem 8.4.19
Finding Critical Values of (chi)^2 For large numbers of degrees of freedom, we can approximate critical values of as follows:
(chi)^2 = (1/2)(z + sqrt(2k-1))
Here k is the number of degrees of freedom and z is the critical value(s) found from technology or Table A-2. In Exercise 12 “Spoken Words” we have df = 55, so Table A-4 does not list an exact critical value. If we want to approximate a critical value of (chi)^2 in the right-tailed hypothesis test with α = 0.01 and a sample size of 56, we let k =55 with z = 2.33 (or the more accurate value of z = 2.326348 found from technology). Use this approximation to estimate the critical value of for Exercise 12. How close is it to the critical value of (chi)^2 = 82.292 obtained by using Statdisk and Minitab?
Problem 8.3.4
Test Statistic and Critical Value The statistics for the sample data in Exercise 1 are n = 15, x_bar = 6.133333, and s = 8.862978, where the units are millions of dollars. Find the test statistic and critical value(s) for a test of the claim that the salaries are from a population with a mean greater than 5 million dollars. Assume that a 0.05 significance level is used.
Problem 8.2.14
Testing Claims About Proportions
In Exercises 9–32, test the given claim. Identify the null hypothesis, alternative hypothesis, test statistic, P-value, or critical value(s), then state the conclusion about the null hypothesis, as well as the final conclusion that addresses the original claim. Use the P-value method unless your instructor specifies otherwise. Use the normal distribution as an approximation to the binomial distribution, as described in Part 1 of this section.
Medical Malpractice In a study of 1228 randomly selected medical malpractice lawsuits, it was found that 856 of them were dropped or dismissed (based on data from the Physicians Insurers Association of America). Use a 0.01 significance level to test the claim that most medical malpractice lawsuits are dropped or dismissed. Should this be comforting to physicians?
Problem 8.1.13
Finding P-Values
In Exercises 13–16, do the following:
i. Identify the hypothesis test as being two-tailed, left-tailed, or right-tailed.
ii. Find the P-value. (See Figure 8-3.)
iii. Using a significance level of α = 0.05 should we reject H0 or should we fail to reject H0?
The test statistic of z = -0.75 is obtained when testing the claim that p<1/3.
Problem 8.1.2
Estimates vs. Hypothesis Tests Labels on cans of Dr. Pepper soda indicate that they contain 12 oz of the drink. We could collect samples of those cans and accurately measure the actual contents, then we could use methods of Section 7-2 for making an estimate of the mean amount of Dr. Pepper in cans, or we could use those measured amounts to test the claim that the cans contain a mean of 12 oz. What is the difference between estimating the mean and testing a hypothesis about the mean?
Problem 8.1.27
Type I and Type II Errors
In Exercises 25–28, provide statements that identify the type I error and the type II error that correspond to the given claim. (Although conclusions are usually expressed in verbal form, the answers here can be expressed with statements that include symbolic expressions such as p = 0.1.)
The proportion of drivers who make angry gestures is greater than 0.25.
Problem 8.1.16
Finding P-Values
In Exercises 13–16, do the following:
i. Identify the hypothesis test as being two-tailed, left-tailed, or right-tailed.
ii. Find the P-value. (See Figure 8-3.)
iii. Using a significance level of α = 0.05 should we reject H0 or should we fail to reject H0?
The test statistic of z = -1.60 is obtained when testing the claim that p ≠ 0.455.
Problem 8.2.29
Testing Claims About Proportions
In Exercises 9–32, test the given claim. Identify the null hypothesis, alternative hypothesis, test statistic, P-value, or critical value(s), then state the conclusion about the null hypothesis, as well as the final conclusion that addresses the original claim. Use the P-value method unless your instructor specifies otherwise. Use the normal distribution as an approximation to the binomial distribution, as described in Part 1 of this section.
Belief in Ghosts In a Harris Interactive poll of 2250 adults, 42% of the respondents said that they believe in ghosts. Use a 0.01 significance level to test the claim that more than of adults believe in ghosts.
Problem 8.2.16
Testing Claims About Proportions
In Exercises 9–32, test the given claim. Identify the null hypothesis, alternative hypothesis, test statistic, P-value, or critical value(s), then state the conclusion about the null hypothesis, as well as the final conclusion that addresses the original claim. Use the P-value method unless your instructor specifies otherwise. Use the normal distribution as an approximation to the binomial distribution, as described in Part 1 of this section.
Internet Use A random sample of 5005 adults in the United States includes 751 who do not use the Internet (based on three Pew Research Center polls). Use a 0.05 significance level to test the claim that the percentage of U.S. adults who do not use the Internet is now less than 48%, which was the percentage in the year 2000. If there appears to be a difference, is it dramatic?
Problem 8.1.23
Final Conclusions
In Exercises 21–24, use a significance level of α = 0.05 and use the given information for the following:
State a conclusion about the null hypothesis. (Reject H0 or fail to reject H0.)
Without using technical terms or symbols, state a final conclusion that addresses the original claim.
Original claim: The mean pulse rate (in beats per minute) of adult males is 72 bpm. The hypothesis test results in a P-value of 0.0095.
Problem 8.5.5
Randomization: Testing a Claim About a Proportion
In Exercises 5–8, use the randomization procedure for the indicated exercise.
Section 8-2, Exercise 9 “Cursed Movie”