Female Motorcycle Owners Here is a 95% confidence interval estimate of the percentage of motorcycle owners who are female: 17.5%<p<20.6% (based on data from the Motorcycle Industry Council). What is the best point estimate of the percentage of motorcycle owners who are women?
Table of contents
- 1. Intro to Stats and Collecting Data1h 14m
- 2. Describing Data with Tables and Graphs1h 56m
- 3. Describing Data Numerically2h 5m
- 4. Probability2h 16m
- 5. Binomial Distribution & Discrete Random Variables3h 6m
- 6. Normal Distribution and Continuous Random Variables2h 11m
- 7. Sampling Distributions & Confidence Intervals: Mean3h 23m
- Sampling Distribution of the Sample Mean and Central Limit Theorem19m
- Distribution of Sample Mean - Excel23m
- Introduction to Confidence Intervals15m
- Confidence Intervals for Population Mean1h 18m
- Determining the Minimum Sample Size Required12m
- Finding Probabilities and T Critical Values - Excel28m
- Confidence Intervals for Population Means - Excel25m
- 8. Sampling Distributions & Confidence Intervals: Proportion2h 10m
- 9. Hypothesis Testing for One Sample5h 8m
- Steps in Hypothesis Testing1h 6m
- Performing Hypothesis Tests: Means1h 4m
- Hypothesis Testing: Means - Excel42m
- Performing Hypothesis Tests: Proportions37m
- Hypothesis Testing: Proportions - Excel27m
- Performing Hypothesis Tests: Variance12m
- Critical Values and Rejection Regions28m
- Link Between Confidence Intervals and Hypothesis Testing12m
- Type I & Type II Errors16m
- 10. Hypothesis Testing for Two Samples5h 37m
- Two Proportions1h 13m
- Two Proportions Hypothesis Test - Excel28m
- Two Means - Unknown, Unequal Variance1h 3m
- Two Means - Unknown Variances Hypothesis Test - Excel12m
- Two Means - Unknown, Equal Variance15m
- Two Means - Unknown, Equal Variances Hypothesis Test - Excel9m
- Two Means - Known Variance12m
- Two Means - Sigma Known Hypothesis Test - Excel21m
- Two Means - Matched Pairs (Dependent Samples)42m
- Matched Pairs Hypothesis Test - Excel12m
- Two Variances and F Distribution29m
- Two Variances - Graphing Calculator16m
- 11. Correlation1h 24m
- 12. Regression3h 33m
- Linear Regression & Least Squares Method26m
- Residuals12m
- Coefficient of Determination12m
- Regression Line Equation and Coefficient of Determination - Excel8m
- Finding Residuals and Creating Residual Plots - Excel11m
- Inferences for Slope31m
- Enabling Data Analysis Toolpak1m
- Regression Readout of the Data Analysis Toolpak - Excel21m
- Prediction Intervals13m
- Prediction Intervals - Excel19m
- Multiple Regression - Excel29m
- Quadratic Regression15m
- Quadratic Regression - Excel10m
- 13. Chi-Square Tests & Goodness of Fit2h 21m
- 14. ANOVA2h 28m
8. Sampling Distributions & Confidence Intervals: Proportion
Confidence Intervals for Population Proportion
Problem 7.3d
Textbook Question
Voting Survey In a survey of 1002 people, 70% said that they voted in a recent presidential election (based on data from ICR Research Group). Voting records show that 61% of eligible voters actually did vote.
d. Are the survey results consistent with the actual voter turnout of 61%? Why or why not?
 Verified step by step guidance
1
Step 1: Define the null hypothesis (H₀) and the alternative hypothesis (H₁). The null hypothesis assumes that the survey results are consistent with the actual voter turnout, i.e., the proportion of people who said they voted (p̂ = 0.70) is equal to the actual voter turnout (p = 0.61). The alternative hypothesis assumes that the survey results are not consistent with the actual voter turnout.
Step 2: Identify the sample size (n), the sample proportion (p̂), and the population proportion (p). Here, n = 1002, p̂ = 0.70, and p = 0.61.
Step 3: Calculate the standard error (SE) of the sample proportion using the formula: SE = sqrt((p * (1 - p)) / n). This measures the variability of the sample proportion under the assumption that the null hypothesis is true.
Step 4: Compute the z-score to determine how many standard errors the sample proportion (p̂) is away from the population proportion (p). Use the formula: z = (p̂ - p) / SE.
Step 5: Compare the calculated z-score to the critical z-value for a chosen significance level (e.g., α = 0.05). If the z-score falls outside the critical range, reject the null hypothesis and conclude that the survey results are not consistent with the actual voter turnout. Otherwise, fail to reject the null hypothesis and conclude that the survey results are consistent with the actual voter turnout.
 Verified video answer for a similar problem:
This video solution was recommended by our tutors as helpful for the problem above
Video duration:
4mPlay a video:
0 Comments
Key Concepts
Here are the essential concepts you must grasp in order to answer the question correctly.
Survey Sampling
Survey sampling involves selecting a subset of individuals from a larger population to estimate characteristics of the whole group. In this case, the survey of 1002 people aims to infer voting behavior among the entire eligible voter population. Understanding sampling methods and biases is crucial for evaluating the reliability of survey results.
Recommended video:

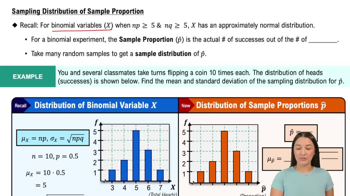
Sampling Distribution of Sample Proportion
Response Bias
Response bias occurs when participants in a survey provide inaccurate or untruthful answers, often due to social desirability or misunderstanding the question. In the context of the voting survey, the discrepancy between the 70% reported voting and the 61% actual turnout may suggest that respondents over-reported their voting behavior, highlighting the importance of considering bias in survey results.
Recommended video:

Creating Pie Charts
Statistical Consistency
Statistical consistency refers to the degree to which survey results align with actual data or established benchmarks. In this scenario, comparing the 70% survey result with the 61% actual voter turnout raises questions about the validity of the survey. Analyzing the consistency helps determine if the survey accurately reflects the true voting behavior of the population.
Recommended video:
Guided course

Parameters vs. Statistics

 5:45m
5:45mWatch next
Master Constructing Confidence Intervals for Proportions with a bite sized video explanation from Patrick
Start learningRelated Videos
Related Practice
Textbook Question
