Join thousands of students who trust us to help them ace their exams!Watch the first video
Multiple Choice
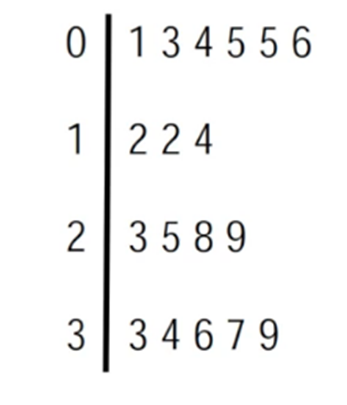
Find the mode of the data in the stemplot below.
A
5,2
B
5,12
C
12
D
0 Comments
Verified step by step guidance
1
Step 1: Understand the stemplot structure. In a stemplot, the left column represents the 'stem' (e.g., tens place), and the right column represents the 'leaf' (e.g., ones place). Combine the stem and leaf to form the actual data points.
Step 2: Extract the data points from the stemplot. For example, for stem '0' and leaves '1, 3, 4, 5, 5, 6', the data points are 1, 3, 4, 5, 5, and 6. Repeat this process for all stems.
Step 3: List all the data points extracted from the stemplot. From the image, the data points are: 1, 3, 4, 5, 5, 6, 12, 12, 14, 23, 25, 28, 33, 34, 36, 37, and 39.
Step 4: Identify the mode of the data set. The mode is the value(s) that appear most frequently in the data set. Count the frequency of each data point to determine the mode.
Step 5: Conclude the mode based on the frequency count. If there is a tie for the highest frequency, list all values with the highest frequency as the mode.


 Verified step by step guidance
