Multiple Choice
Find the area under the standard normal distribution to the left of a z-score of .
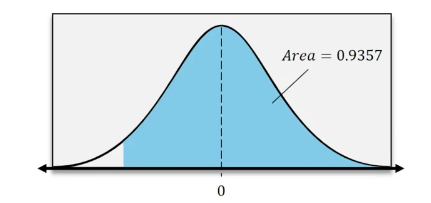
-1.52
1.52
0.82
-0.82
 Verified step by step guidance
 9:47m
9:47mMaster Finding Standard Normal Probabilities using z-Table with a bite sized video explanation from Patrick
Start learning
