Back
BackProblem 7.1.37b
Smart Phone Apple is planning for the launch of a new and improved iPhone. The marketing team wants to know the worldwide percentage of consumers who intend to purchase the new model, so a survey is being planned. How many people must be surveyed in order to be 90% confident that the estimated percentage is within three percentage points of the true population percentage?
b. Assume that 11% of consumers have a smartphone and plan to upgrade to a new model.
Problem 7.1.37c
Smart Phone Apple is planning for the launch of a new and improved iPhone. The marketing team wants to know the worldwide percentage of consumers who intend to purchase the new model, so a survey is being planned. How many people must be surveyed in order to be 90% confident that the estimated percentage is within three percentage points of the true population percentage?
c. Given that the required sample size is relatively small, could you simply survey the people that you know?
Problem 7.1.38c
Women Who Give Birth An epidemiologist plans to conduct a survey to estimate the percentage of women who give birth. How many women must be surveyed in order to be 99% confident that the estimated percentage is in error by no more than two percentage points?
c. What is wrong with surveying randomly selected adult women?
Problem 7.1.40
One-Sided Confidence Interval A one-sided claim about a population proportion is a claim that the proportion is less than (or greater than) some specific value. Such a claim can be formally addressed using a one-sided confidence interval for p, which can be expressed as p<p+E or p>p-E, where the margin of error E is modified by replacing za/2 with za. (Instead of dividing between two tails of the standard normal distribution, put all of it in one tail.) The Chapter Problem refers to a Sallie Mae survey of 950 undergraduate students, and 53% of the survey subjects take online courses. Use that data to construct a one-sided 95% confidence interval that would be suitable for helping to determine whether the percentage of all undergraduates who take online courses is greater than 50%.
Problem 7.1.33a
E-Cigarettes A New York Times article reported that a survey conducted in 2014 included 36,000 adults, with 3.7% of them being regular users of e-cigarettes. Because e-cigarette use is relatively new, there is a need to obtain today’s usage rate. How many adults must be surveyed now if we want a confidence level of 95% and a margin of error of 1.5 percentage points?
a. Assume that nothing is known about the rate of e-cigarette usage among adults.
Problem 7.1.41a
No Failures According to the Rule of Three, when we have a sample size n with x=0 successes, we have 95% confidence that the true population proportion has an upper bound of 3/n. (See “A Look at the Rule of Three,” by Jovanovic and Levy, American Statistician, Vol. 51, No. 2.)
a. If n independent trials result in no successes, why can’t we find confidence interval limits by using the methods described in this section?
Problem 7.1.42b
No Failures According to the Rule of Three, when we have a sample size n with x=0 successes, we have 95% confidence that the true population proportion has an upper bound of 3/n. (See “A Look at the Rule of Three,” by Jovanovic and Levy, American Statistician, Vol. 51, No. 2.)
b. In a study of failure rates of computer hard drives, 45 Toshiba model MD04ABA500V hard drives were tested and there were no failures. What is the 95% upper bound for the percentage of failures for the population of all such hard drives?
Problem 7.1
Female Motorcycle Owners Here is a 95% confidence interval estimate of the percentage of motorcycle owners who are female: 17.5%<p<20.6% (based on data from the Motorcycle Industry Council). What is the best point estimate of the percentage of motorcycle owners who are women?
Problem 7.2.33
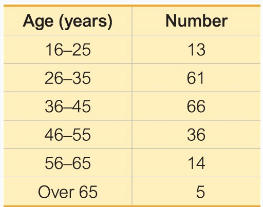
Ages of Prisoners The accompanying frequency distribution summarizes sample data consisting of ages of randomly selected inmates in federal prisons (based on data from the Federal Bureau of Prisons). Use the data to construct a 95% confidence interval estimate of the mean age of all inmates in federal prisons.
Problem 7.2.34b
Finite Population Correction Factor If a simple random sample of size n is selected without replacement from a finite population of size (n>0.05N), and the sample size is more than 5% of the population size , better results can be obtained by using the finite population correction factor, which involves multiplying the margin of error E by [Image]. Refer to the weights of the M&M candies in Data Set 38 “Candies” in Appendix B.
b. Use only the red M&Ms and treat that sample as a simple random sample selected from the population of the 345 M&Ms listed in the data set. Find the 95% confidence interval estimate of the mean weight of all 345 M&Ms. Compare the result to the actual mean of the population of all 345 M&Ms.
Problem 7.2.7
In Exercises 5–8, (a) identify the critical value ta/2 used for finding the margin of error, (b) find the margin of error, (c) find the confidence interval estimate of u, and (d) write a brief statement that interprets the confidence interval.
Pepsi Weights Here are summary statistics for the weights of Pepsi in randomly selected cans: n=36, x=0.82410 lb, s=0.00570 lb (based on Data Set 37 “Cola Weights and Volumes” in Appendix B). Use a confidence level of 99%.
Problem 7.2.9
Mean Body Temperature Data Set 5 “Body Temperatures” in Appendix B includes a sample of 106 body temperatures having a mean of 98.20 F and a standard deviation of 0.62 F. Construct a 95% confidence interval estimate of the mean body temperature for the entire population. What does the result suggest about the common belief that 98.6 F is the mean body temperature?
Problem 7.2.10
Atkins Weight Loss Program In a test of weight loss programs, 40 adults used the Atkins weight loss program. After 12 months, their mean weight loss was found to be 2.1 lb, with a standard deviation of 4.8 lb. Construct a 90% confidence interval estimate of the mean weight loss for all such subjects. Does the Atkins program appear to be effective? Does it appear to be practical?
Problem 7.2.13
Archeology Archeologists have studied sizes of Egyptian skulls in an attempt to determine whether breeding occurred between different cultures. Listed below are the widths (mm) of skulls from 150 A.D. (based on data from Ancient Races of the Thebaid by Thomson and Randall-Maciver). Construct a 99% confidence interval estimate of the mean skull width.
Problem 7.2.14
Minting Quarters Listed below are weights (grams) of quarters minted after 1964 (based on Data Set 40 “Coin Weights” in Appendix B). Construct a 95% confidence interval estimate of the mean weight of all quarters minted after 1964. Specifications require that the quarters have a weight of 5.670 g. What does the confidence interval suggest about that specification?
Problem 7.2.15
Los Angeles Commute Time Listed below are 15 Los Angeles commute times (based on a sample from Data Set 31 “Commute Times” in Appendix B). Construct a 99% confidence interval estimate of the population mean. Is the confidence interval a good estimate of the population mean?
Problem 7.2.17
Genes Samples of DNA are collected, and the four DNA bases of A, G, C, and T are coded as 1, 2, 3, and 4, respectively. The results are listed below. Construct a 95% confidence interval estimate of the mean. What is the practical use of the confidence interval?
2 2 1 4 3 3 3 3 4 1
Problem 7.2.19
Mercury in Sushi An FDA guideline is that the mercury in fish should be below 1 part per million (ppm). Listed below are the amounts of mercury (ppm) found in tuna sushi sampled at different stores in New York City. The study was sponsored by the New York Times, and the stores (in order) are D’Agostino, Eli’s Manhattan, Fairway, Food Emporium, Gourmet Garage, Grace’s Marketplace, and Whole Foods. Construct a 98% confidence interval estimate of the mean amount of mercury in the population. Does it appear that there is too much mercury in tuna sushi?
0.56 0.75 0.10 0.95 1.25 0.54 0.88
Problem 7.2.22
Mean IQ of Data Scientists See the preceding exercise, in which we can assume that sigma=15 for the IQ scores. Data scientists are a group with IQ scores that vary less than the IQ scores of the general population. Find the sample size needed to estimate the mean IQ of data scientists, given that we want 98% confidence that the sample mean is within 2 IQ points of the population mean. Does the sample size appear to be practical?
Problem 7.2.23
Ages of Moviegoers Find the sample size needed to estimate the mean age of movie patrons, given that we want 98% confidence that the sample mean is within 1.5 years of the population mean. Assume that sigma=19.6 years, based on a previous report from the Motion Picture Association of America. Could the sample be obtained from one movie at one theater?
Problem 7.2.25a
Mean Pulse Rate of Males Data Set 1 “Body Data” in Appendix B includes pulse rates of 153 randomly selected adult males, and those pulse rates vary from a low of 40 bpm to a high of 104 bpm. Find the minimum sample size required to estimate the mean pulse rate of adult males. Assume that we want 99% confidence that the sample mean is within 2 bpm of the population mean.
a. Find the sample size using the range rule of thumb to estimate .
Problem 7.2.25b
Mean Pulse Rate of Males Data Set 1 “Body Data” in Appendix B includes pulse rates of 153 randomly selected adult males, and those pulse rates vary from a low of 40 bpm to a high of 104 bpm. Find the minimum sample size required to estimate the mean pulse rate of adult males. Assume that we want 99% confidence that the sample mean is within 2 bpm of the population mean.
b. Assume that sigma=11.3 bpm, based on the value of s=11.3 bpm for the sample of 153 male pulse rates.
Problem 7.2.26b
Mean Pulse Rate of Females Data Set 1 “Body Data” in Appendix B includes pulse rates of 147 randomly selected adult females, and those pulse rates vary from a low of 36 bpm to a high of 104 bpm. Find the minimum sample size required to estimate the mean pulse rate of adult females. Assume that we want 99% confidence that the sample mean is within 2 bpm of the population mean.
b. Assume that sigma=12.5 bpm, based on the value of s=12.5 bpm for the sample of 147 female pulse rates.
Problem 7.2.28b
Mean Body Temperature Data Set 5 “Body Temperatures” in Appendix B includes 106 body temperatures of adults for Day 2 at 12 AM, and they vary from a low of 96.5F to a high of 99.6F. Find the minimum sample size required to estimate the mean body temperature of all adults. Assume that we want 98% confidence that the sample mean is within 0.1F of the population mean.
b. Assume that sigma=0.62F, based on the value of s=0.62F for the sample of 106 body temperatures.
Problem 7.2.30
Second-Hand Smoke Refer to Data Set 15 “Passive and Active Smoke” and construct a 95% confidence interval estimates of the mean cotinine level in each of three samples: (1) people who smoke; (2) people who don’t smoke but are exposed to tobacco smoke at home or work; (3) people who don’t smoke and are not exposed to smoke. Measuring cotinine in people’s blood is the most reliable way to determine exposure to nicotine. What do the confidence intervals suggest about the effects of smoking and second-hand smoke?
Problem 7.3.21
Large Data Sets from Appendix B. In Exercises 21 and 22, use the data set in Appendix B. Assume that each sample is a simple random sample obtained from a population with a normal distribution.
Comparing Waiting Lines Refer to Data Set 30 “Queues” in Appendix B. Construct separate 95% confidence interval estimates of using the two-line wait times and the single-line wait times. Do the results support the expectation that the single line has less variation? Do the wait times from both line configurations satisfy the requirements for confidence interval estimates of sigma
Problem 7.3.18
Determining Sample Size. Assume that each sample is a simple random sample obtained from a normally distributed population.
You want to estimate for the population of diastolic blood pressures of air traffic controllers in the United States. Find the minimum sample size needed to be 95% confident that the sample standard deviation s is within 1% of σ. Is this sample size practical?
Problem 7.3.3
Red Blood Cell Count Here is a 95% confidence interval estimate of obtained by using the red blood cell counts of adult females listed in Data Set 1 “Body Data” in Appendix B:
[Image].
Identify the corresponding confidence interval estimate of and include the appropriate units.
Problem 7.3.5
Use the given information to find the number of degrees of freedom, the critical values X2L and X2R, and the confidence interval estimate of σ. It is reasonable to assume that a simple random sample has been selected from a population with a normal distribution:
Nicotine in Menthol Cigarettes 95% confidence; n = 25, s = 0.24 mg
Problem 7.3.8
use the given information to find the number of degrees of freedom, the critical values X2L and X2R, and the confidence interval estimate of σ. It is reasonable to assume that a simple random sample has been selected from a population with a normal distribution:
Heights of Men 99% confidence; n=153, s=7.10 cm.