Back
BackProblem 2.3.5
In Exercises 5 and 6, construct the dotplot.
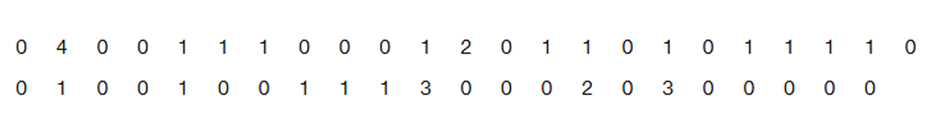
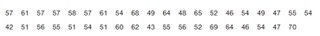
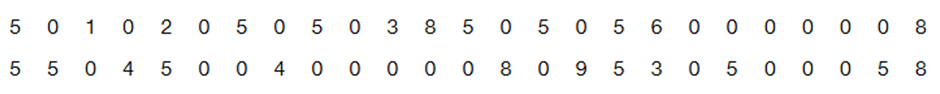
Pulse Rates Listed below are pulse rates (beats per minute) of females selected from Data Set 1 “Body Data” in Appendix B. All of those pulse rates are even numbers. Is there a pulse rate that appears to be an outlier? What is its value?
Problem 2.2.6
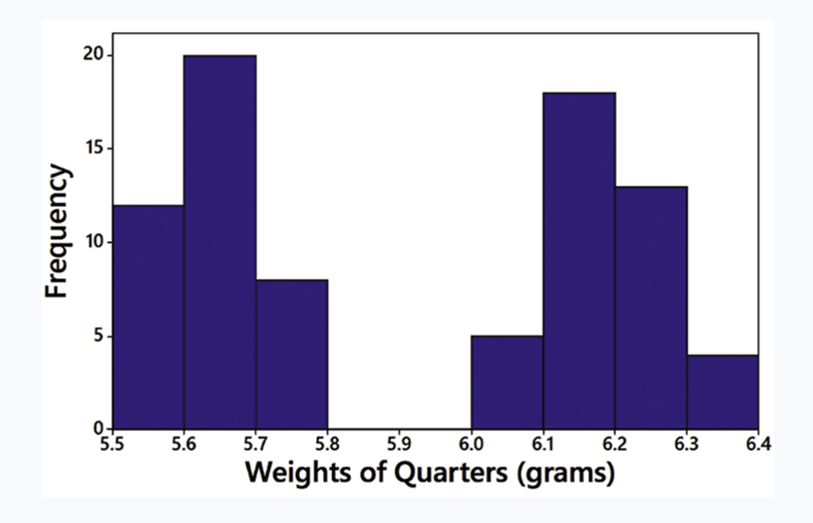
In Exercises 5–8, answer the questions by referring to the following Minitab-generated histogram, which depicts the weights (grams) of all quarters listed in Data Set 40 “Coin Weights” in Appendix B. (Grams are actually units of mass and the values shown on the horizontal scale are rounded.)
Class Width and Class Limits Give the approximate values of the class width, and the lower and upper class limits of the class depicted in the bar farthest to the left.
Problem 2.3.19
In Exercises 17–20, identify how the graph is deceptive.
Cost of Giving Birth According to the Agency for Healthcare Research and Quality Healthcare Cost and Utilization Project, the typical cost of a C-section baby delivery is $4500, and the typical cost of a vaginal delivery is $2600. See the following illustration.
Problem 2.1.20
Hershey Kisses Refer to Data Set 38 “Candies” and use the weights (grams) of Hershey’s Kisses. Begin with a lower class limit of 4.300 g and use a class width of 0.100 g. Does this distribution appear to be a normal distribution?
Problem 2.1.16
Tornadoes Listed below are the F-scale intensities of recent tornadoes in the United States. Construct a frequency distribution. Do the intensities appear to have a normal distribution?
Problem 2.1.12
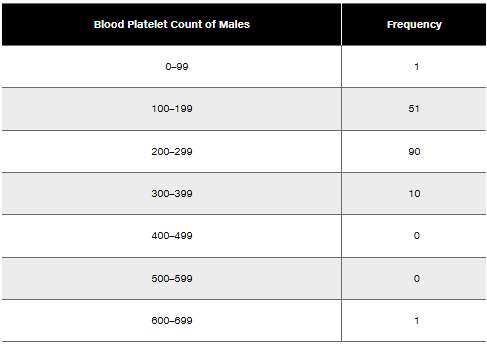
In Exercises 9–12, using a loose interpretation of the criteria for determining whether a frequency distribution is approximately a normal distribution, determine whether the given frequency distribution is approximately a normal distribution. Give a brief explanation.
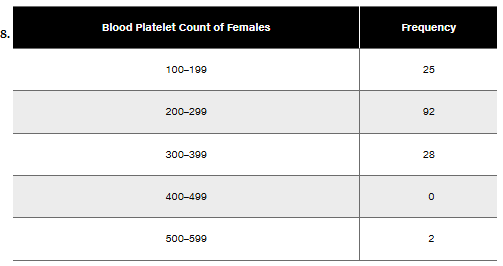
Blood Platelet Counts of Females Refer to the frequency distribution from Exercise 8
Problem 2.2.12
In Exercises 9–18, construct the histograms and answer the given questions.
Tornadoes Use the frequency distribution from Exercise 16 in Section 2-1 to construct a histogram. Does the histogram appear to be skewed? If so, identify the type of skewness.
Problem 2.1.34
Exercises 29–34 involve large sets of data, so technology should be used. Complete lists of the data are not listed in Appendix B, but they can be downloaded from the website TriolaStats.com. Use the indicated data and construct the frequency distribution.
Earthquake Depths Use the depths (km) of the 600 earthquakes included in Data Set 24 “Earthquakes.” Use a class width of 10.0 km and begin with a lower class limit of 0.0 km. Does the frequency distribution appear to be a normal distribution?
Problem 2.1.10
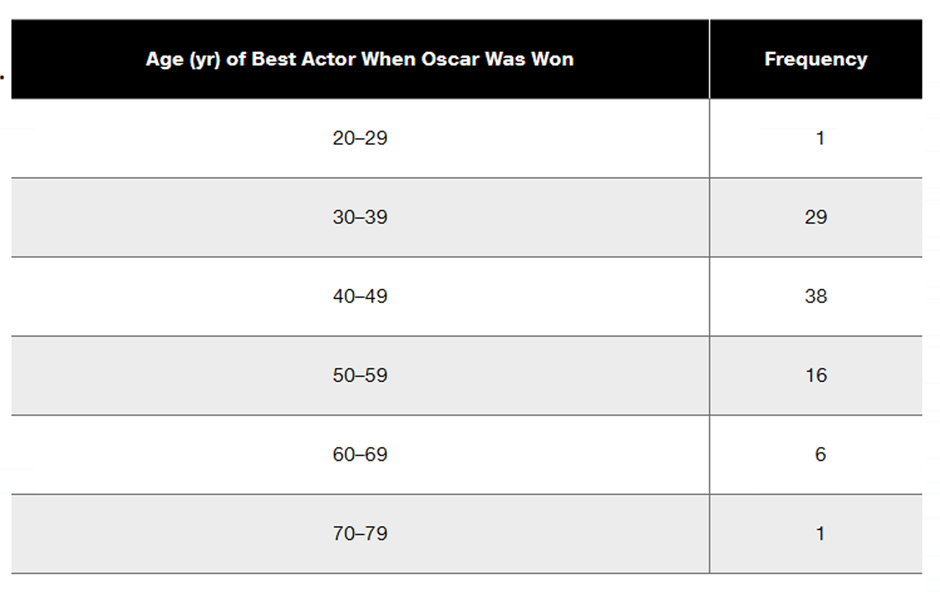
In Exercises 9–12, using a loose interpretation of the criteria for determining whether a frequency distribution is approximately a normal distribution, determine whether the given frequency distribution is approximately a normal distribution. Give a brief explanation.
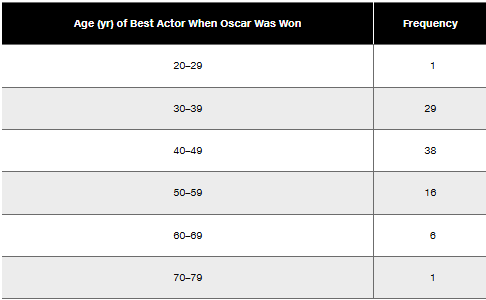
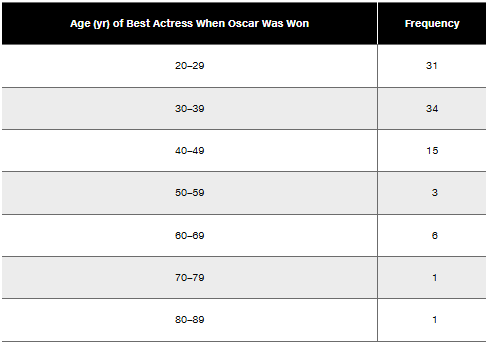
Best Actors Refer to the frequency distribution from Exercise 6
Problem 2.3.10
In Exercises 9 and 10, construct the time-series graph.
Home Runs Listed below are the numbers of home runs in Major League Baseball for each year beginning with 1993 (listed in order by row). Is there a trend?
Problem 2.1.14
Presidents Listed below are the ages (years) of presidents of the United States at the times of their first inaugurations (from Data Set 22 “Presidents” in Appendix B). Presidents who took office as a result of an assassination or resignation are not included. The data are current as of this writing. Use these ages to construct a frequency distribution. Use a class width of 5 years and begin with a lower class limit of 40 years. Do the ages appear to have a normal distribution?
Problem 2.4.6
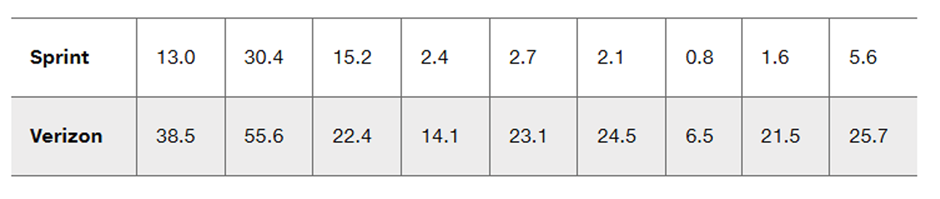
Airport Data Speeds Listed below are the cellular data speeds (Mbps) from Sprint and Verizon measured at nine different airports (based on data from CNN). What would the presence of a correlation suggest about Sprint and Verizon?
Problem 2.1.5
In Exercises 5–8, identify the class width, class midpoints, and class boundaries for the given frequency distribution. Also identify the number of individuals included in the summary. The frequency distributions are based on real data from Appendix B.
Problem 2.1.32
Exercises 29–34 involve large sets of data, so technology should be used. Complete lists of the data are not listed in Appendix B, but they can be downloaded from the website TriolaStats.com. Use the indicated data and construct the frequency distribution.
Diastolic Blood Pressure Use the diastolic blood pressures of the 300 subjects included in Data Set 1 “Body Data.” Use a class width of 15 mm Hg and begin with a lower class limit of 40 mm Hg. Does the frequency distribution appear to be a normal distribution?
Problem 2.1.7
In Exercises 5–8, identify the class width, class midpoints, and class boundaries for the given frequency distribution. Also identify the number of individuals included in the summary. The frequency distributions are based on real data from Appendix B.
7.
Problem 2.4.2
Causation A study has shown that there is a correlation between body weight and blood pressure. Higher body weights are associated with higher blood pressure levels. Can we conclude that gaining weight is a cause of increased blood pressure?
Problem 2.2.1
IQ Scores IQ scores of adults are normally distributed. If a large sample of adults is randomly selected and the IQ scores are illustrated in a histogram, what is the shape of that histogram?
Problem 2.2.2
More IQ Scores The population of IQ scores of adults is normally distributed. If we obtain a voluntary response sample of 5000 of those IQ scores, will a histogram of the sample be bell-shaped?
Problem 2.1.19
Freshman 15 Refer to Data Set 13 “Freshman 15” and use the second column, which lists weights (kg) in September of college freshmen. Begin with a lower class limit of 40 kg and use a class width of 10 kg. Does the distribution appear to be a normal distribution?
Problem 2.3.13
In Exercises 13 and 14, construct the pie chart.
Box Office Boffo Use the data from Exercise 11 “Box Office Boffo.”
"Recent annual gross revenue (millions of dollars) for the leading movie studios are as follows: 20th Century Fox (1082), Buena Vista (3092), Paramount (757), Sony/Columbia (1304), Universal (1772), Warner Brothers (1941)."
Problem 2.2.17
In Exercises 9–18, construct the histograms and answer the given questions.
Analysis of Last Digits Use the frequency distribution from Exercise 21 in Section 2-1 to construct a histogram. What can be concluded from the distribution of the digits? Specifically, do the heights appear to be reported or actually measured?
Problem 2.3.6
In Exercises 5 and 6, construct the dotplot.
Diastolic Blood Pressure Listed below are diastolic blood pressure measurements (mm Hg) of females selected from Data Set 1 “Body Data” in Appendix B. All of the values are even numbers. Are there any outliers? If so, identify their values.
Problem 2.3.16
In Exercises 15 and 16, construct the frequency polygons.
Presidents Use the frequency distribution from Exercise 14 in Section 2-1 to construct a frequency polygon. Does the graph suggest that the distribution is skewed? If so, how?
Problem 2.1.31
Exercises 29–34 involve large sets of data, so technology should be used. Complete lists of the data are not listed in Appendix B, but they can be downloaded from the website TriolaStats.com. Use the indicated data and construct the frequency distribution.
Systolic Blood Pressure Use the systolic blood pressures of the 300 subjects included in Data Set 1 “Body Data.” Use a class width of 20 mm Hg and begin with a lower class limit of 80 mm Hg. Does the frequency distribution appear to be a normal distribution?
Problem 2.2.14
In Exercises 9–18, construct the histograms and answer the given questions.
Burger King Dinner Service Times Use the frequency distribution from Exercise 18 in Section 2-1 to construct a histogram. Using a strict interpretation of the criteria for being a normal distribution, does the histogram appear to depict data from a population with a normal distribution?
Problem 2.1.28
Births Natural births randomly selected from four hospitals in New York State occurred on the days of the week (in the order of Monday through Sunday) with these frequencies: 52, 66, 72, 57, 57, 43, 53. Does it appear that such births occur on the days of the week with equal frequency?
Problem 2.1.22
Analysis of Last Digits Weights of respondents were recorded as part of the California Health Interview Survey. The last digits of weights from 50 randomly selected respondents are listed below. Construct a frequency distribution with 10 classes. Based on the distribution, do the weights appear to be reported or actually measured? Does there appear to be a gap in the frequencies and, if so, how might that gap be explained? What do you know about the accuracy of the results?
Problem 2.1.23
In Exercises 23 and 24, construct the relative frequency distributions and answer the given questions.
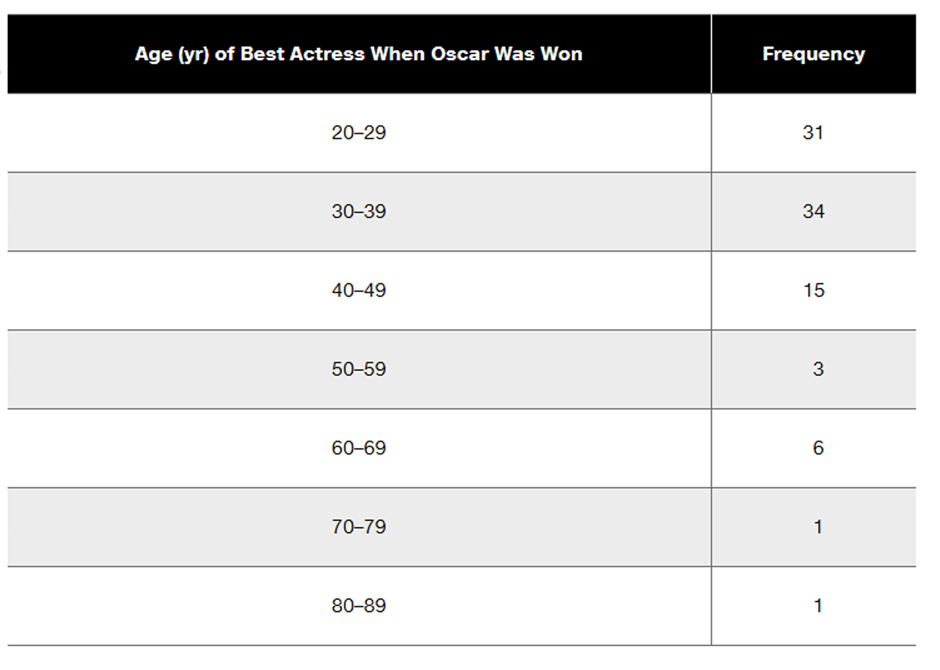
Oscar Winners Construct one table (similar to Table 2-5) that includes relative frequencies based on the frequency distributions from Exercises 5 and 6, and then compare the ages of Oscar-winning actresses and actors. Are there notable differences?
Problem 2.3.22
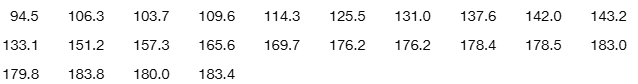
V and Digital Ads Listed below are amounts (billions of dollars) spent on TV and digital advertising. The amounts are listed in order by year ending with the year 2022. The last few years are projected amounts (based on data from Magna Global). Construct a graph that reveals the story that the data are trying to tell. What story does the graph depict?
TV Ads:
[Image]
Problem 2.3.11
In Exercises 11 and 12 construct the Pareto chart.
Box Office Boffo Recent annual gross revenue (millions of dollars) for the leading movie studios are as follows: 20th Century Fox (1082), Buena Vista (3092), Paramount (757), Sony/Columbia (1304), Universal (1772), Warner Brothers (1941). Are these data likely to be reasonably accurate?