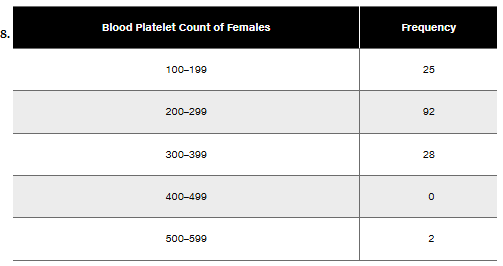
Presidents Listed below are the ages (years) of presidents of the United States at the times of their first inaugurations (from Data Set 22 “Presidents” in Appendix B). Presidents who took office as a result of an assassination or resignation are not included. The data are current as of this writing. Use these ages to construct a frequency distribution. Use a class width of 5 years and begin with a lower class limit of 40 years. Do the ages appear to have a normal distribution?
Table of contents
- 1. Intro to Stats and Collecting Data55m
- 2. Describing Data with Tables and Graphs1h 55m
- 3. Describing Data Numerically1h 45m
- 4. Probability2h 16m
- 5. Binomial Distribution & Discrete Random Variables2h 33m
- 6. Normal Distribution and Continuous Random Variables1h 38m
- 7. Sampling Distributions & Confidence Intervals: Mean1h 53m
- 8. Sampling Distributions & Confidence Intervals: Proportion1h 12m
- 9. Hypothesis Testing for One Sample2h 19m
- 10. Hypothesis Testing for Two Samples3h 22m
- 11. Correlation1h 6m
- 12. Regression1h 4m
- 13. Chi-Square Tests & Goodness of Fit1h 20m
- 14. ANOVA1h 0m
2. Describing Data with Tables and Graphs
Frequency Distributions
Problem 2.1.12
Textbook Question
In Exercises 9–12, using a loose interpretation of the criteria for determining whether a frequency distribution is approximately a normal distribution, determine whether the given frequency distribution is approximately a normal distribution. Give a brief explanation.
Blood Platelet Counts of Females Refer to the frequency distribution from Exercise 8


1
Step 1: Review the frequency distribution table provided. The table lists blood platelet counts of females in intervals (100–199, 200–299, etc.) along with their corresponding frequencies.
Step 2: Check for symmetry in the distribution. A normal distribution typically has frequencies that increase to a peak and then decrease symmetrically. Observe whether the frequencies rise to a peak and then fall off in a balanced manner.
Step 3: Identify the peak frequency. In this case, the interval 200–299 has the highest frequency (92). Compare the frequencies of intervals on either side of the peak to see if they decrease symmetrically.
Step 4: Look for gaps or irregularities. Note that the interval 400–499 has a frequency of 0, which disrupts the smooth decline expected in a normal distribution. This gap suggests the distribution may not be normal.
Step 5: Consider the shape of the distribution. Based on the frequencies, the distribution appears skewed rather than bell-shaped, as the frequencies do not decrease symmetrically around the peak. Provide an explanation that the distribution is not approximately normal due to the lack of symmetry and the presence of gaps.

This video solution was recommended by our tutors as helpful for the problem above
Video duration:
2mPlay a video:
Was this helpful?
Key Concepts
Here are the essential concepts you must grasp in order to answer the question correctly.
Normal Distribution
A normal distribution is a probability distribution that is symmetric about the mean, showing that data near the mean are more frequent in occurrence than data far from the mean. It is characterized by its bell-shaped curve, where the mean, median, and mode are all equal. Understanding this concept is crucial for determining if a frequency distribution approximates normality.
Recommended video:
Guided course
Finding Z-Scores for Non-Standard Normal Variables
Frequency Distribution
A frequency distribution is a summary of how often each value occurs in a dataset. It displays the number of occurrences (frequency) of each category or range of values. Analyzing the frequency distribution helps in visualizing the data and assessing its shape, which is essential for evaluating whether it resembles a normal distribution.
Recommended video:
Guided course
Intro to Frequency Distributions
Criteria for Normality
The criteria for determining if a distribution is approximately normal include assessing the symmetry of the distribution, the presence of a single peak (unimodality), and the tails of the distribution. A common method is to use graphical representations like histograms or Q-Q plots, as well as statistical tests. These criteria help in making informed judgments about the normality of the data.
Recommended video:
Guided course
Finding Z-Scores for Non-Standard Normal Variables
Watch next
Master Intro to Frequency Distributions with a bite sized video explanation from Patrick
Start learningRelated Videos
Related Practice
Textbook Question