Here are the essential concepts you must grasp in order to answer the question correctly.
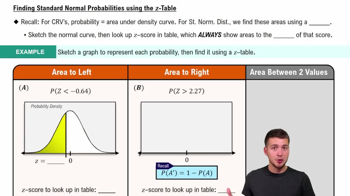
Normal Distribution
A normal distribution is a probability distribution that is symmetric about the mean, showing that data near the mean are more frequent in occurrence than data far from the mean. It is characterized by its bell-shaped curve, where the mean, median, and mode are all equal. Understanding this concept is crucial for determining if the weights of freshmen follow this pattern.
Recommended video:
Finding Standard Normal Probabilities using z-Table
Class Intervals
Class intervals are ranges of values that are grouped together for the purpose of frequency distribution. In this case, a lower class limit of 40 kg and a class width of 10 kg means the intervals will be 40-49 kg, 50-59 kg, and so on. Analyzing data using class intervals helps in visualizing the distribution of weights and identifying patterns.
Recommended video:
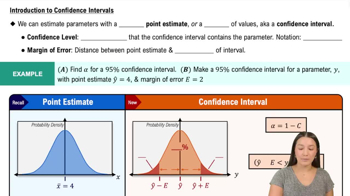
Introduction to Confidence Intervals
Descriptive Statistics
Descriptive statistics summarize and describe the main features of a dataset, including measures of central tendency (mean, median, mode) and measures of variability (range, variance, standard deviation). These statistics provide insights into the distribution of weights and help assess whether the data aligns with the characteristics of a normal distribution.
Recommended video:
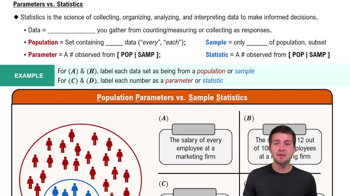
Parameters vs. Statistics