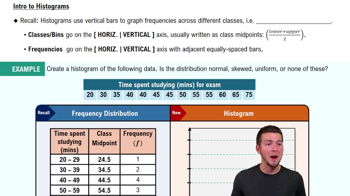
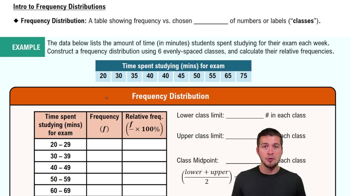
In Exercises 9–18, construct the histograms and answer the given questions.
Chicago Commute Time Use the frequency distribution from Exercise 13 in Section 2-1 to construct a histogram. Does it appear to be the graph of data from a population with a normal distribution?


