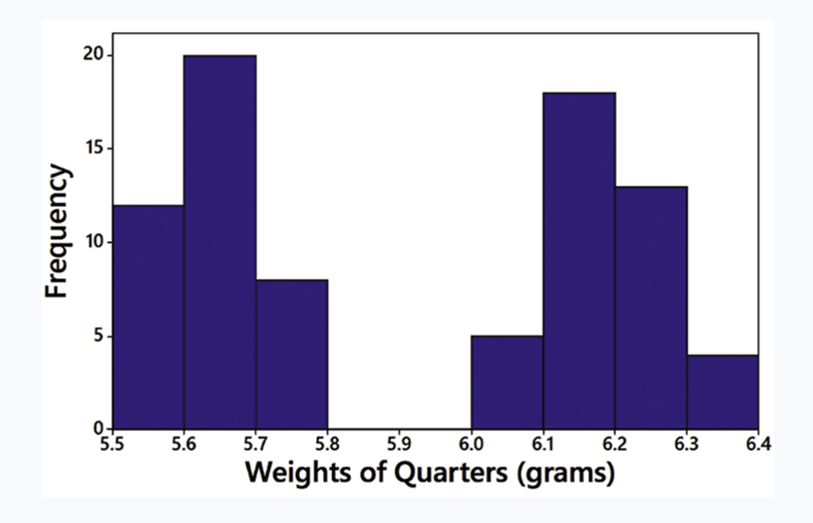
IQ Scores IQ scores of adults are normally distributed. If a large sample of adults is randomly selected and the IQ scores are illustrated in a histogram, what is the shape of that histogram?
Table of contents
- 1. Intro to Stats and Collecting Data1h 14m
- 2. Describing Data with Tables and Graphs1h 55m
- 3. Describing Data Numerically2h 5m
- 4. Probability2h 16m
- 5. Binomial Distribution & Discrete Random Variables3h 6m
- 6. Normal Distribution and Continuous Random Variables2h 11m
- 7. Sampling Distributions & Confidence Intervals: Mean3h 23m
- Sampling Distribution of the Sample Mean and Central Limit Theorem19m
- Distribution of Sample Mean - Excel23m
- Introduction to Confidence Intervals15m
- Confidence Intervals for Population Mean1h 18m
- Determining the Minimum Sample Size Required12m
- Finding Probabilities and T Critical Values - Excel28m
- Confidence Intervals for Population Means - Excel25m
- 8. Sampling Distributions & Confidence Intervals: Proportion1h 12m
- 9. Hypothesis Testing for One Sample3h 29m
- 10. Hypothesis Testing for Two Samples4h 50m
- Two Proportions1h 13m
- Two Proportions Hypothesis Test - Excel28m
- Two Means - Unknown, Unequal Variance1h 3m
- Two Means - Unknown Variances Hypothesis Test - Excel12m
- Two Means - Unknown, Equal Variance15m
- Two Means - Unknown, Equal Variances Hypothesis Test - Excel9m
- Two Means - Known Variance12m
- Two Means - Sigma Known Hypothesis Test - Excel21m
- Two Means - Matched Pairs (Dependent Samples)42m
- Matched Pairs Hypothesis Test - Excel12m
- 11. Correlation1h 6m
- 12. Regression1h 50m
- 13. Chi-Square Tests & Goodness of Fit1h 57m
- 14. ANOVA1h 57m
2. Describing Data with Tables and Graphs
Histograms
Problem 2.2.6
Textbook Question
In Exercises 5–8, answer the questions by referring to the following Minitab-generated histogram, which depicts the weights (grams) of all quarters listed in Data Set 40 “Coin Weights” in Appendix B. (Grams are actually units of mass and the values shown on the horizontal scale are rounded.)

Class Width and Class Limits Give the approximate values of the class width, and the lower and upper class limits of the class depicted in the bar farthest to the left.
Verified step by step guidance1
Step 1: Identify the class width by observing the horizontal axis of the histogram. The class width is the difference between the lower boundary of one class and the lower boundary of the next class. For example, the first class starts at 5.5 and the next class starts at 5.6, so the class width is approximately 0.1 grams.
Step 2: Determine the lower class limit of the bar farthest to the left. The bar farthest to the left starts at 5.5 grams, which is the lower class limit for that class.
Step 3: Determine the upper class limit of the bar farthest to the left. The upper class limit is the value at the end of the class interval. Since the class width is 0.1 grams, the upper class limit for the first bar is approximately 5.6 grams.
Step 4: Verify the frequency of the bar farthest to the left. The height of the bar indicates the frequency, which appears to be approximately 10 based on the vertical axis.
Step 5: Summarize the findings: The class width is approximately 0.1 grams, the lower class limit is 5.5 grams, and the upper class limit is 5.6 grams for the bar farthest to the left.
Verified video answer for a similar problem:This video solution was recommended by our tutors as helpful for the problem above
Video duration:
2mPlay a video:
Was this helpful?
Key Concepts
Here are the essential concepts you must grasp in order to answer the question correctly.
Histogram
A histogram is a graphical representation of the distribution of numerical data, where the data is divided into intervals or 'bins.' Each bin's height reflects the frequency of data points within that interval. In this case, the histogram displays the weights of quarters, allowing for visual analysis of how these weights are distributed across different ranges.
Recommended video:
Guided course
Intro to Histograms
Class Width
Class width refers to the range of values that each bin in a histogram covers. It is calculated by subtracting the lower limit of a class from its upper limit. For the leftmost bar in the histogram, identifying the class width is essential for understanding how the data is grouped and for making comparisons between different intervals.
Recommended video:
Guided course
How to Create Frequency Distributions Example 2
Class Limits
Class limits define the boundaries of each bin in a histogram. The lower class limit is the smallest value that can fall into that bin, while the upper class limit is the largest. For the leftmost bar in the histogram, determining these limits is crucial for accurately interpreting the data and understanding the specific range of weights represented.
Recommended video:
Guided course
How to Create Frequency Distributions
Related Videos
Related Practice
Textbook Question
