Here are the essential concepts you must grasp in order to answer the question correctly.
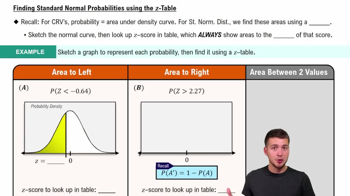
Normal Distribution
A normal distribution is a continuous probability distribution characterized by a symmetric, bell-shaped curve. It is defined by its mean and standard deviation, with most data points clustering around the mean. In the context of IQ scores, which are normally distributed, this means that most individuals will have scores near the average, with fewer individuals having extremely high or low scores.
Recommended video:
Finding Standard Normal Probabilities using z-Table
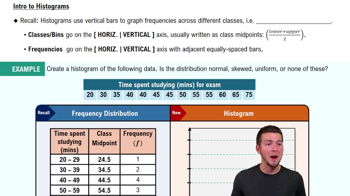
Histogram
A histogram is a graphical representation of the distribution of numerical data, where data is grouped into bins or intervals. The height of each bar in a histogram represents the frequency of data points within each bin. For normally distributed data, such as IQ scores, the histogram will typically exhibit a bell-shaped curve, reflecting the underlying normal distribution.
Recommended video:
Central Limit Theorem
The Central Limit Theorem states that the distribution of the sample mean will approximate a normal distribution as the sample size becomes large, regardless of the shape of the population distribution. This concept is crucial in understanding why the histogram of a large sample of IQ scores, which are normally distributed, will also display a normal distribution shape, reinforcing the bell curve pattern.
Recommended video: