
Textbook Question
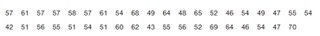
Boston Commute Time The accompanying table summarizes daily commute times in Boston. How many commute times are included in the summary? Is it possible to identify the exact values of all of the original data amounts?
 Verified step by step guidanceVerified video answer for a similar problem:
 06:38
06:38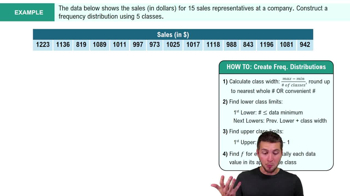 05:18
05:18 03:17
03:17