Back
BackProblem 2.RE.14
In Exercises 13 and 14, find the mean, the median, and the mode of the data, if possible. If any measure cannot be found or does not represent the center of the data, explain why.
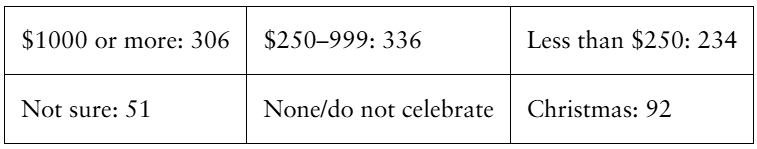
The responses of 1019 adults who were asked how much money they think they will spend on Christmas gifts in a recent year (Adapted from Gallup)
Problem 2.DS.2a
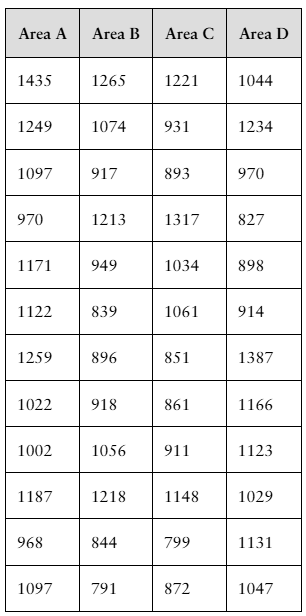
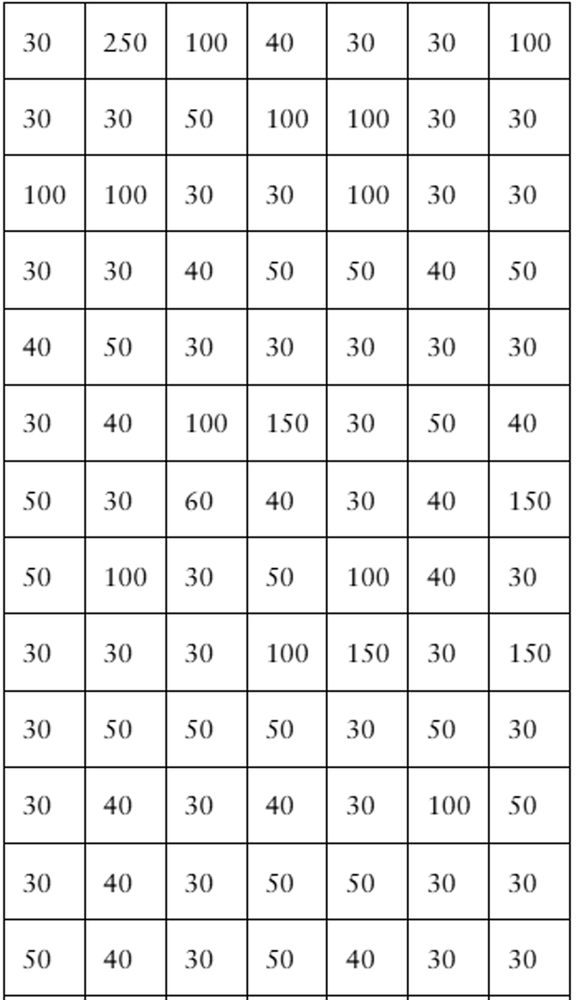
You are a member of your local apartment association. The association represents rental housing owners and managers who operate residential rental property throughout the greater metropolitan area. Recently, the association has received several complaints from tenants in a particular area of the city who feel that their monthly rental fees are much higher compared to other parts of the city.
You want to investigate the rental fees. You gather the data shown in the table at the right. Area A represents the area of the city where tenants are unhappy about their monthly rents. The data represent the monthly rents paid by a random sample of tenants in Area A and three other areas of similar size. Assume all the apartments represented are approximately the same size with the same amenities.
a. What type of graph would you choose to display the data? Explain your reasoning.
Problem 2.DS.2c
You are a member of your local apartment association. The association represents rental housing owners and managers who operate residential rental property throughout the greater metropolitan area. Recently, the association has received several complaints from tenants in a particular area of the city who feel that their monthly rental fees are much higher compared to other parts of the city.
You want to investigate the rental fees. You gather the data shown in the table at the right. Area A represents the area of the city where tenants are unhappy about their monthly rents. The data represent the monthly rents paid by a random sample of tenants in Area A and three other areas of similar size. Assume all the apartments represented are approximately the same size with the same amenities.
c. Based on your data displays, does it appear that the monthly rents in Area A are higher than the rents in the other areas of the city? Explain.
Problem 2.R.37
In Exercises 37– 40, use the data set, which represents the model 2020 vehicles with the highest fuel economies (in miles per gallon) in the most popular classes. (Source: U.S. Environmental Protection Agency)
36 30 30 45 31 113 113 33 33 33 52 141 56 117 58
118 50 26 23 23 27 48 22 22 22 121 41 105 35 35
Find the five-number summary of the data set.
Problem 2.R.40
In Exercises 37– 40, use the data set, which represents the model 2020 vehicles with the highest fuel economies (in miles per gallon) in the most popular classes. (Source: U.S. Environmental Protection Agency)
36 30 30 45 31 113 113 33 33 33 52 141 56 117 58
118 50 26 23 23 27 48 22 22 22 121 41 105 35 35
About how many vehicles fall on or below the third quartile?
Problem 2.R.25
In Exercises 25 and 26, find the range, mean, variance, and standard deviation of the population data set.
The mileages (in thousands of miles) for a rental car company’s fleet.
4 2 9 12 15 3 6 8 1 4 14 12 3 3
Problem 2.R.28
In Exercises 27 and 28, find the range, mean, variance, and standard deviation of the sample data set.
Salaries (in dollars) of a random sample of teachers
62,222 56,719 50,259 45,120 47,692 45,985 53,489 71,534
Problem 2.R.31
The mean sale per customer for 40 customers at a gas station is $32.00, with a standard deviation of $4.00. Using Chebychev’s Theorem, determine at least how many of the customers spent between $24.00 and $40.00.
Problem 2.R.34
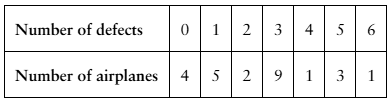
From a random sample of airplanes, the number of defects found in their fuselages are listed. Find the sample mean and the sample standard deviation of the data.
Problem 2.Q.6a
Refer to the sample statistics from Exercise 5 and determine whether any of the house prices below are unusual. Explain your reasoning.
a. $225,000
Problem 2.Q.6d
Refer to the sample statistics from Exercise 5 and determine whether any of the house prices below are unusual. Explain your reasoning.
d. $147,000
Problem 2.T.3
Use frequency distribution formulas to estimate the sample mean and the sample standard deviation of the data set in Exercise 2.
Problem 2.T.9
Use the frequency distribution in Exercise 4 to estimate the sample mean and sample standard deviation of the data. Do the formulas for grouped data give results that are as accurate as the individual entry formulas? Explain.
Problem 2.CR.6b
The mean annual salary for a sample of electrical engineers is $86,500, with a standard deviation of $1500. The data set has a bell-shaped distribution.
b. The salaries of three randomly selected electrical engineers are $93,500, $85,600, and $82,750. Find the z-score that corresponds to each salary. Determine whether any of these salaries are unusual.
Problem 2.R.46
The towing capacities (in pounds) of all the pickup trucks at a dealership have a bell-shaped distribution, with a mean of 11,830 pounds and a standard deviation of 2370 pounds. In Exercises 45– 48, use the corresponding z-score to determine whether the towing capacity is unusual. Explain your reasoning.
5,500 pounds
Problem 2.T.8b
The mean gestational length of a sample of 208 horses is 343.7 days, with a standard deviation of 10.4 days. The data set has a bell-shaped distribution.
b. Determine whether a gestational length of 318.4 days is unusual.
Problem 2.Q.1d
The data set represents the number of minutes a sample of 27 people exercise each week.
108 139 120 123 120 132 123 131 131
157 150 124 111 101 135 119 116 117
127 128 139 119 118 114 127 142 130
d. Describe the shape of the distribution as symmetric, uniform, skewed left, skewed right, or none of these.
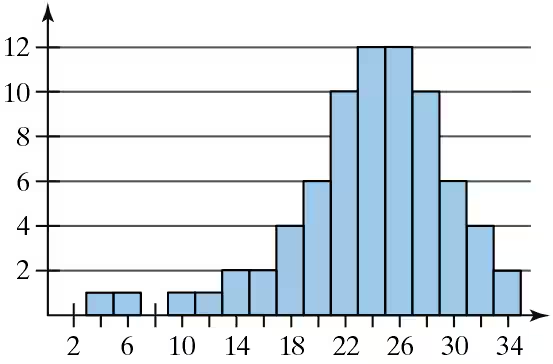
Problem 2.R.22
In Exercises 21 and 22, determine whether the approximate shape of the distribution in the histogram is symmetric, uniform, skewed left, skewed right, or none of these.
Problem 2.R.19
Describe the shape of the distribution for the histogram you made in Exercise 3 as symmetric, uniform, skewed left, skewed right, or none of these.
Problem 2.T.5
"According to data from the city of Toronto, Ontario, Canada, there were nearly 112,000 parking infractions in the city for December 2020, with fines totaling over 5,500,000 Canadian dollars. The fines (in Canadian dollars) for a random sample of 105 parking infractions in Toronto, Ontario, Canada, for December 2020 are listed below. (Source: City of Toronto)
In Exercises 1–5, use technology. If possible, print your results.
Draw a histogram for the data. Does the distribution appear to be bell-shaped?"
Problem 2.1.45b
What Would You Do? You work at a bank and are asked to recommend the amount of cash to put in an ATM each day. You do not want to put in too much (which would cause security concerns) or too little (which may create customer irritation). The daily withdrawals (in hundreds of dollars) for 30 days are listed. 72 84 61 76 104 76 86 92 80 88 98 76 97 82 84 67 70 81 82 89 74 73 86 81 85 78 82 80 91 83
If you put $9000 in the ATM each day, what percent of the days in a month should you expect to run out of cash? Explain.
Problem 2.1.45c
What Would You Do? You work at a bank and are asked to recommend the amount of cash to put in an ATM each day. You do not want to put in too much (which would cause security concerns) or too little (which may create customer irritation). The daily withdrawals (in hundreds of dollars) for 30 days are listed. 72 84 61 76 104 76 86 92 80 88 98 76 97 82 84 67 70 81 82 89 74 73 86 81 85 78 82 80 91 83
If you are willing to run out of cash on 10% of the days, how much cash should you put in the ATM each day? Explain.
Problem 2.1.46c
What Would You Do? The admissions department for a college is asked to recommend the minimum SAT scores that the college will accept for full-time students. The SAT scores of 50 applicants are listed. 1170 1000 910 870 1070 1290 920 1470 1080 1180 770 900 1120 1070 1370 1160 970 930 1240 1270 1250 1330 1010 1010 1410 1130 1210 1240 960 820 650 1010 1190 1500 1400 1270 1310 1050 950 1150 1450 1290 1310 1100 1330 1410 840 1040 1090 1080
If you want to accept the top 88% of the applicants, what should the minimum score be? Explain.
Problem 2.1.3
What is the difference between class limits and class boundaries?
Problem 2.1.6
What is the difference between a frequency polygon and an ogive?
Problem 2.1.13
use the given information about the data set and the number of classes to find the class width, the lower class limits, and the upper class limits.
min=17, range=118, 8 classes
Problem 2.1.16
use the frequency distribution to find the (a) class width, (b) class midpoints, and (c) class boundaries.
Toledo, OH, Average Normal Temperatures (F)
Problem 2.1.26a
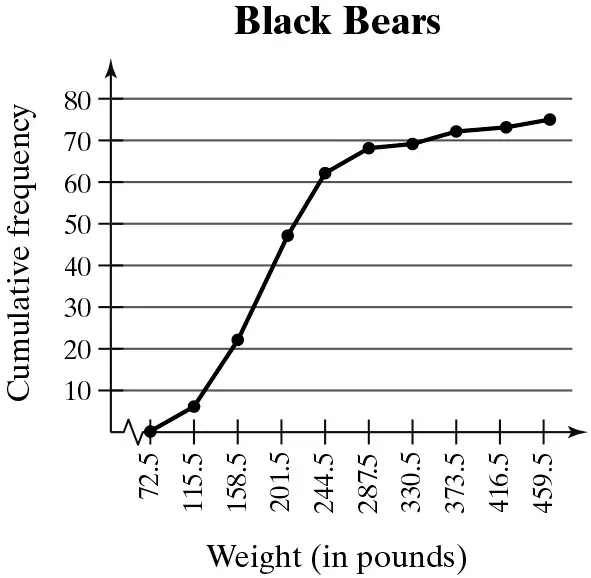
use the ogive to approximate
the number in the sample.
Problem 2.1.27c
Use the ogive to approximate the
the number of black bears that weigh between 158.5 pounds and 244.5 pounds.
Problem 2.1.28b
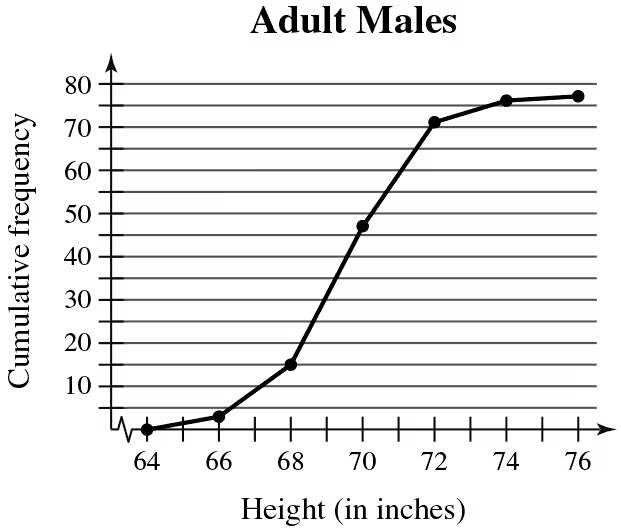
Use the ogive to approximate
the height for which the cumulative frequency is 15.