Back
BackProblem 1.1.13
"Determine whether the data set is a population or a sample. Explain your reasoning.
A survey of 250 members from an organized union of over 20,000 members"
Problem 1.3.34
Determine whether the survey question is biased. If the question is biased, suggest a better wording.
How does the media influence the opinions of voters?
Problem 1.1.7
"Determine whether the statement is true or false. If it is false, rewrite it as a true statement.
It is impossible to obtain all the census data about the U.S. population."
Problem 1.3.29
Determine whether you would take a census or use a sampling. If you would use a sampling, determine which sampling technique you would use. Explain.
The average GPA of the 85 students on a college football team roster
Problem 1.2.32
"Determine whether the data are qualitative or quantitative, and determine the level of measurement of the data set.
The numbers of performances for the 10 longest-running original runs of Broadway shows as of March 15, 2020, are listed. (Source: Playbill)
13,370 9692 9302 7485 6836 6680 6137 5959 5758 5461"
Problem 1.2.4
"Determine whether the statement is true or false. If it is false, rewrite it as a true statement.
For data at the interval level, you cannot calculate meaningful differences between data entries."
Problem 1.1.14
Determine whether the data set is a population or a sample. Explain your reasoning.
The annual revenue of each team in a pro sports league
Problem 1.1.24
Use the Venn diagram to identify the population and the sample.
Problem 1.1.30
Identify the population and the sample. Describe the sample data set.
A survey of 214 of the seniors graduating with a bachelor of science degree from a university found that 15% planned to obtain entry-level jobs in the health field.
Problem 1.2.29
Determine whether the data are qualitative or quantitative, and determine the level of measurement of the data set.
Census Regions The four geographical regions of the United States recognized by the U.S. Census Bureau are listed.
Northeast, South, Midwest, West
Problem 1.2.13
"Determine whether the data are qualitative or quantitative. Explain your reasoning.
Distances of track events"
Problem 1.3.22
Volunteers for an experiment are numbered from 1 to 90. The volunteers are to be randomly assigned to two different treatment groups. Use a random number generator different from the one you used in Exercise 21 to choose 45 subjects for the treatment group. The other 45 subjects will go into the control group. List the subjects, according to number, in each group. Tell which method you used to generate the random numbers.
Problem 1.3.25
"Identify the sampling technique used, and discuss potential sources of bias (if any). Explain.
After a hurricane, a disaster area is divided into 200 equal grids. Thirty of the grids are selected, and every occupied household in the grid is interviewed to help focus relief efforts on what residents require the most."
Problem 1.1.18
Determine whether the data set is a population or a sample. Explain your reasoning.
The amount spent by every tenth person cashing out at a store
Problem 1.1.2
Why is a sample used more often than a population?
Problem 1.1.47
A study showed the same level of T cell production in senior citizens who are amateur cyclists as in young adults, but a significantly lower level of T cell production in senior citizens who do not exercise regularly. Is it appropriate to infer that exercise stimulates T cell production? Explain. (Source: University of Birmingham)
Problem 1.2.17
Determine the level of measurement of the data set. Explain your reasoning.
The lengths (in centimeters) of 22 Ford automobiles are listed. (Source: Automobiledimension.com)
404 407 410 416 421 438 440 443 461 467 471 478 480 483 483 485 487 487 497 505 534 536
Problem 1.2.2
Name each level of measurement for which data can be quantitative.
Problem 1.2.1
Name each level of measurement for which data can be qualitative.
Problem 1.3.13
Determine whether the study is an observational study or an experiment. Explain.
A study used periodic blood pressure readings and brain MRIs of adults to find that adults with long periods of high blood pressure were more likely to develop cerebral small blood vessel disease. (Source: American Heart Association)
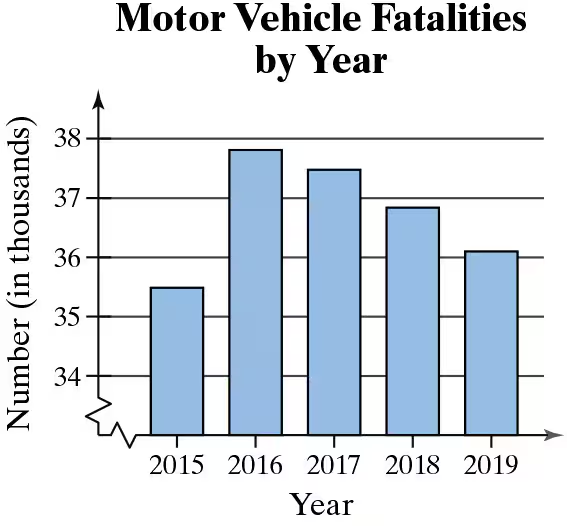
Problem 1.2.24
Determine the level of measurement of the data listed on the horizontal and vertical axes in the figure.
Problem 1.3.11
Determine whether the study is an observational study or an experiment. Explain.
A research study compared the memory retention of subjects when a learning activity was followed by a brief period of wakeful rest and when a learning activity was followed by a brief period of distraction. (Source: Springer Nature)
Problem 1.1.33
"Identify the population and the sample. Describe the sample data set.
To gather information about starting salaries at companies listed in the Standard & Poor’s 500, a researcher contacts 74 of the 500 companies."
Problem 1.1.11
"Determine whether the data set is a population or a sample. Explain your reasoning.
The salary of each employee of an advertising firm"
Problem 1.2.5
Determine whether the statement is true or false. If it is false, rewrite it as a true statement.
More types of calculations can be performed with data at the nominal level than with data at the interval level.
Problem 1.2.25
The items below appear on a physician’s intake form. Determine the level of measurement of the data for each category.
a. Temperature
b. Allergies
c. Weight
d. Pain level (scale of 0 to 10)
Problem 1.2.30
Determine whether the data are qualitative or quantitative, and determine the level of measurement of the data set.
The top six final scores at the 2021 U.S. Women’s Figure Skating Championships are listed. (Source: NBC Sports)
232.61 215.33 214.98 213.39 199.95 178.89
Problem 1.3.30
Determine whether you would take a census or use a sampling. If you would use a sampling, determine which sampling technique you would use. Explain.
The average distance traveled to a stadium by 55,000 spectators
Problem 1.1.43
Which part of the survey described in Exercise 31 represents the descriptive branch of statistics? What conclusions might be drawn from the survey using inferential statistics?
Problem 1.3.33
Determine whether the survey question is biased. If the question is biased, suggest a better wording.
How much do you exercise during an average week?