Back
BackProblem 1.CR.2
In Exercises 1 and 2, identify the sampling technique used, and discuss potential sources of bias (if any). Explain.
Using random digit dialing, researchers asked 1090 U.S. adults their level of education.
Problem 2.5.55
Extending Concepts
Midquartile Another measure of position is called the midquartile. You can find the midquartile of a data set by using the formula below.
Midquartile = (Q₁ + Q₃) / 2
In Exercises 55 and 56, find the midquartile of the data set.
5 7 1 2 3 10 8 7 5 3
Problem 2.1.41
Construct a cumulative frequency distribution and an ogive for the data set using six classes. Then describe the location of the greatest increase in frequency.
Retirement Ages
Data set: Retirement ages of 35 English professors 72 62 55 61 53 62 65 66 69 55 66 63 67 69 55 65 67 57 67 68 73 75 65 54 71 57 52 58 58 71 72 67 63 65 61
Problem 2.3.50
Finding the Mean of a Frequency Distribution In Exercises 49–52, approximate the mean of the frequency distribution.
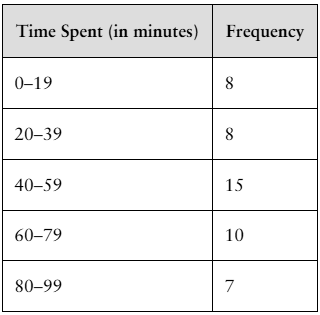
Social Media The average daily amounts of time (in minutes) spent on Snapchat
Problem 2.3.55
Identifying the Shape of a Distribution In Exercises 53–56, construct a frequency distribution and a frequency histogram for the data set using the indicated number of classes. Describe the shape of the histogram as symmetric, uniform, negatively skewed, positively skewed, or none of these.
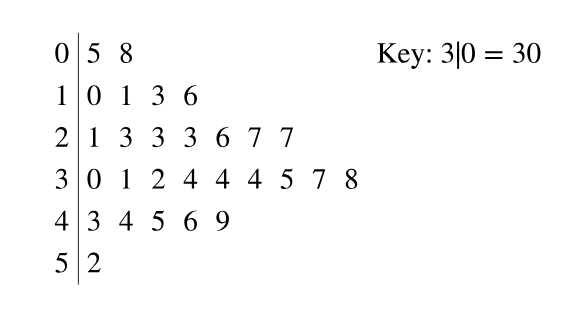
Heights of Males
Number of classes: 5
Data set: The heights (to the nearest inch) of 30 males
67 76 69 68 72 68 65 63 75 69
66 72 67 66 69 73 64 62 71 73
68 72 71 65 69 66 74 72 68 69
Problem 2.5.24
Using Technology to Find Quartiles and Draw Graphs In Exercises 23–26, use technology to draw a box-and-whisker plot that represents the data set.
Vacation Days The number of vacation days used by a sample of 20 employees in a recent year
3 9 2 1 7 5 3 2 2 6
4 0 10 0 3 5 7 8 6 5
Problem 2.3.44
Finding a Weighted Mean In Exercises 41– 46, find the weighted mean of the data.
Credit Card Balance For the month of October, a credit card has a balance of $115.63 for 12 days, $637.19 for 6 days, $1225.06 for 7 days, $0 for 2 days, and $34.88 for 4 days. What is the account’s mean daily balance for October?
Problem 2.3.17
Using and Interpreting Concepts
Finding and Discussing the Mean, Median, and Mode In Exercises 17–34, find the mean, the median, and the mode of the data, if possible. If any measure cannot be found or does not represent the center of the data, explain why.
College Credits The number of credits being taken by a sample of 14 full-time college students for a semester
12 14 16 15 13 14 15
18 16 16 12 16 15 17
Problem 2.5.35
Finding a Percentile In Exercises 33–36, use the data set, which represents the ages of 30 executives.
43 57 65 47 57 41 56 53 61 54
56 50 66 56 50 61 47 40 50 43
54 41 48 45 28 35 38 43 42 44
Which ages are above the 75th percentile?
Problem 2.3.6
Constructing Data Sets In Exercises 5– 8, construct the described data set. The entries in the data set cannot all be the same.
Mean and median are the same and the data is bimodal.
Problem 2.3.3
Building Basic Skills and Vocabulary
True or False? In Exercises 1– 4, determine whether the statement is true or false. If it is false, rewrite it as a true statement.
A data set can have the same mean, median, and mode.
Problem 2.3.22
Using and Interpreting Concepts
Finding and Discussing the Mean, Median, and Mode In Exercises 17–34, find the mean, the median, and the mode of the data, if possible. If any measure cannot be found or does not represent the center of the data, explain why.
Cholesterol The cholesterol levels of a sample of 10 female employees
154 240 171 188 235 203 184 173 181 275
Problem 2.5.10
True or False? In Exercises 7–10, determine whether the statement is true or false. If it is false, rewrite it as a true statement.
It is impossible to have a z-score of 0.
Problem 2.3.31
Using and Interpreting Concepts
Finding and Discussing the Mean, Median, and Mode In Exercises 17–34, find the mean, the median, and the mode of the data, if possible. If any measure cannot be found or does not represent the center of the data, explain why.
Weights (in pounds) of Packages on a Delivery Truck
Problem 2.4.18
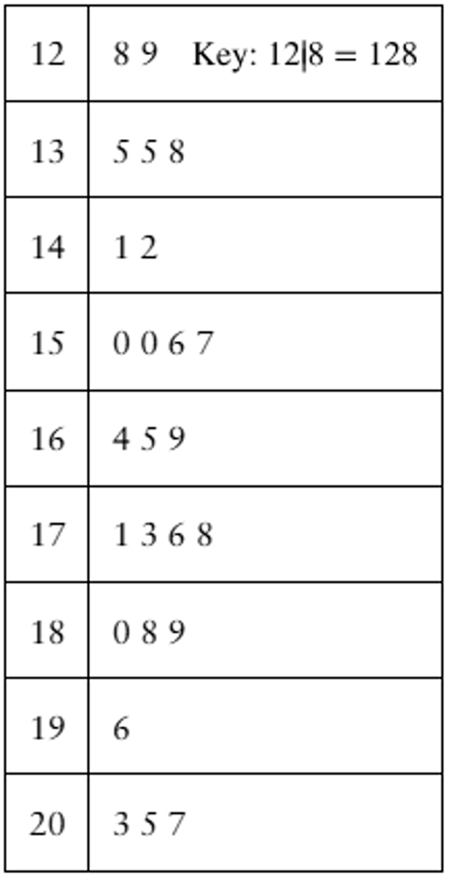
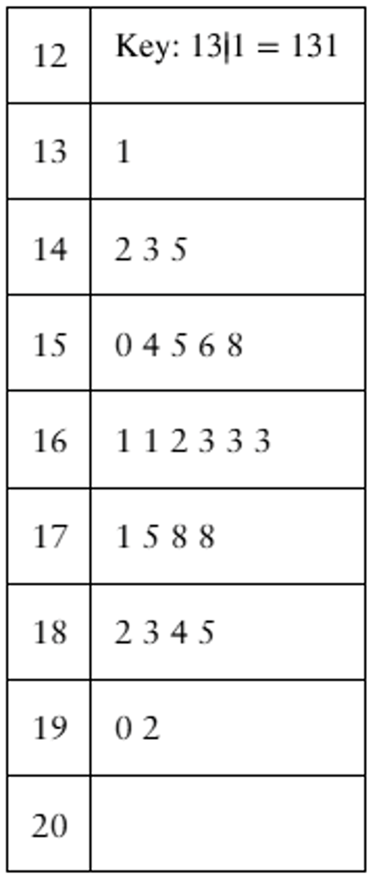
Estimating Standard Deviation Both data sets shown in the stem-and-leaf plots have a mean of 165. One has a standard deviation of 16, and the other has a standard deviation of 24. By looking at the stem-and-leaf plots, which is which? Explain your reasoning.
Problem 2.3.41
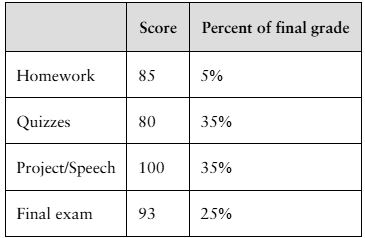
Finding a Weighted Mean In Exercises 41– 46, find the weighted mean of the data.
Final Grade The scores and their percents of the final grade for a statistics student are shown below. What is the student’s mean score?
Problem 2.5.32
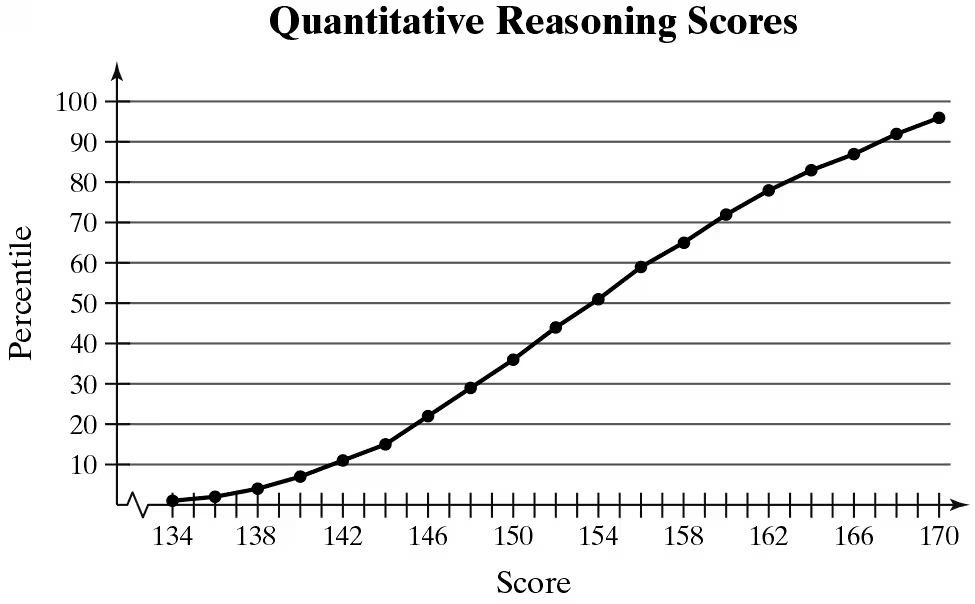
Interpreting Percentiles In Exercises 29–32, use the ogive, which represents the cumulative frequency distribution for quantitative reasoning scores on the Graduate Record Examination in a recent range of years. (Adapted from Educational Testing Service)
What percentile is a score of 170? How should you interpret this?
Problem 2.2.31
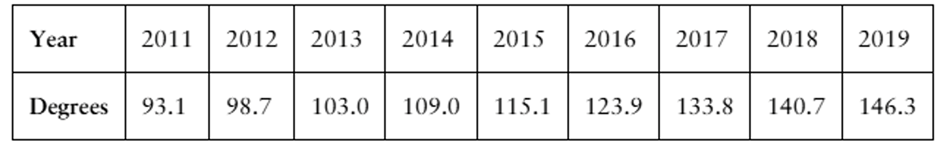
Graphing Data Sets In Exercises 17–32, organize the data using the indicated type of graph. Describe any patterns.
Engineering Degrees Use a time series chart to display the data shown in the table. The data represent the number of bachelor’s degrees in engineering (in thousands) conferred in the U.S. (Source: U.S. Deapartment of Education)
Problem 2.1.30
Construct a frequency distribution for the data set using the indicated number of classes. In the table, include the midpoints, relative frequencies, and cumulative frequencies. Which class has the greatest class frequency and which has the least class frequency.
Textbook Spending
Number of classes: 6
Data set: Amounts (in dollars) spent on textbooks for a semester 91 472 279 249 530 376 188 341 266 199 142 273 189 130 489 266 248 101 375 486 190 398 188 269 43 30 127 354 84 319
Problem 2.5.29
Interpreting Percentiles In Exercises 29–32, use the ogive, which represents the cumulative frequency distribution for quantitative reasoning scores on the Graduate Record Examination in a recent range of years. (Adapted from Educational Testing Service)
What score represents the 65th percentile? How should you interpret this?
Problem 2.5.26
Using Technology to Find Quartiles and Draw Graphs In Exercises 23–26, use technology to draw a box-and-whisker plot that represents the data set.
Hourly Earnings The hourly earnings (in dollars) of a sample of 21 employees at a consulting firm
25.89 27.09 31.76 28.28 26.19 27.43 24.06
25.61 22.56 29.76 18.01 23.66 38.24 37.27
32.70 31.12 25.87 15.06 23.12 30.62 19.85
Problem 2.1.10
Determine whether the statement is true or false. If it is false, rewrite it as a true statement.
Class boundaries ensure that consecutive bars of a histogram touch.
Problem 2.4.13
In Exercises 13 and 14, find the range, mean, variance, and standard deviation of the population data set.
Drunk Driving The number of alcohol-impaired crash fatalities (in thousands) per year from 2010 through 2019 (Source: National Highway Traffic Safety Administration)
10.1 9.9 10.3 10.1 9.9 10.3 11.0 10.9 10.7 10.1
Problem 2.5.1
Building Basic Skills and Vocabulary
The length of a guest lecturer’s talk represents the third quartile for talks in a guest lecture series. Make an observation about the length of the talk.
Problem 2.3.28
Using and Interpreting Concepts
Finding and Discussing the Mean, Median, and Mode In Exercises 17–34, find the mean, the median, and the mode of the data, if possible. If any measure cannot be found or does not represent the center of the data, explain why.
Judicial System The responses of a sample of 34 young adult United Kingdom males in custodial sentences who were asked what is affected by such sentences (Adapted from User Voice)
Mental health: 8
Trust: 3
Education: 8
Personal development: 5
Family: 3
Future opportunities: 3
Other: 4
Problem 2.4.25
Constructing Data Sets In Exercises 25–28, construct a data set that has the given statistics.
N = 6
μ = 5
σ ≈ 2
Problem 2.2.8
Putting Graphs in Context In Exercises 5–8, match the plot with the description of the sample.
a. Times (in minutes) it takes a sample of employees to drive to work
b. Grade point averages of a sample of students with finance majors
c. Top speeds (in miles per hour) of a sample of high-performance sports cars
d. Ages (in years) of a sample of residents of a retirement home
Problem 2.3.48
Grades In Exercise 46, one of the student’s B grades gets changed to an A. What is the student’s new grade point average?
Problem 2.4.36
Using Chebychev’s Theorem Old Faithful is a famous geyser at Yellowstone National Park. From a sample with n = 100, the mean interval between Old Faithful’s eruptions is 101.56 minutes and the standard deviation is 42.69 minutes. Using Chebychev’s Theorem, determine at least how many of the intervals lasted between 16.18 minutes and 186.94 minutes. (Adapted from Geyser Times)
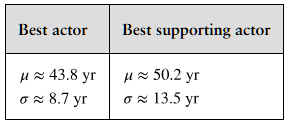
Problem 2.5.53
Comparing z-Scores from Different Data Sets The table shows population statistics for the ages of Best Actor and Best Supporting Actor winners at the Academy Awards from 1929 to 2020. The distributions of the ages are approximately bell-shaped. In Exercises 51–54, compare the z-scores for the actors.
Best Actor 1970: John Wayne, Age: 62
Best Supporting Actor 1970: Gig Young, Age: 56