

 05:53
05:53


Textbook Question
Graphing Data Sets In Exercises 17–32, organize the data using the indicated type of graph. Describe any patterns.
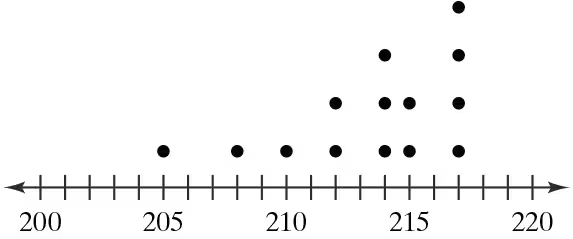
Life Spans of Houseflies Use a dot plot to display the data, which represent the life spans (in days) of 30 houseflies.
9 9 4 11 10 5 13 9 7 11 6 8 14 10 6
10 10 7 14 11 7 8 6 13 10 14 14 8 13 10