Textbook Question
use the ogive to approximate
the number in the sample.
 Verified step by step guidanceVerified video answer for a similar problem:
 06:38
06:38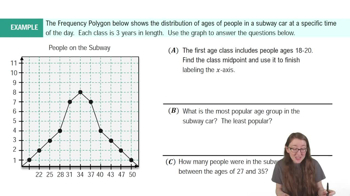 04:15
04:15 04:41
04:41 6:38m
6:38mMaster Intro to Frequency Distributions with a bite sized video explanation from Patrick
Start learning