Multiple Choice
The time-series graph below gives the price (USD) of a gallon of gas each month over the course of a year. Find the time intervals during which gas prices are increasing.

 Verified step by step guidance
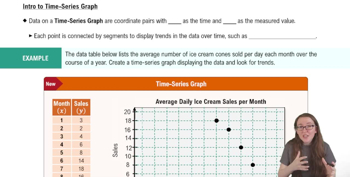
 Verified video answer for a similar problem:


 4:13m
4:13mMaster Creating Time-Series Graphs with a bite sized video explanation from Patrick
Start learning